🚨Stock Market Crash? Or Will It Keep Going Up?
Assessing Market Strength and Risk-Reward Dynamics for Strategic Trading
Hey Traders and VIP Members;
Remember, listen to the audio version on the Substack App for a better experience as we dive into the weekly breadth of the market.
In this report we will talk about:
Is the market bullish or bearish?
What is the bullish vs bearish reading for the week on a scale of 1 to 10?
Charts of the SPY and QQQ and Bitcoin with analysis
From this report you will get:
A understanding of the overall market conditions going into the week with a solid risk reward understanding of how aggressive you can be.
Knowledge straight from a Wall Street Veterans Desk.
S&P 500
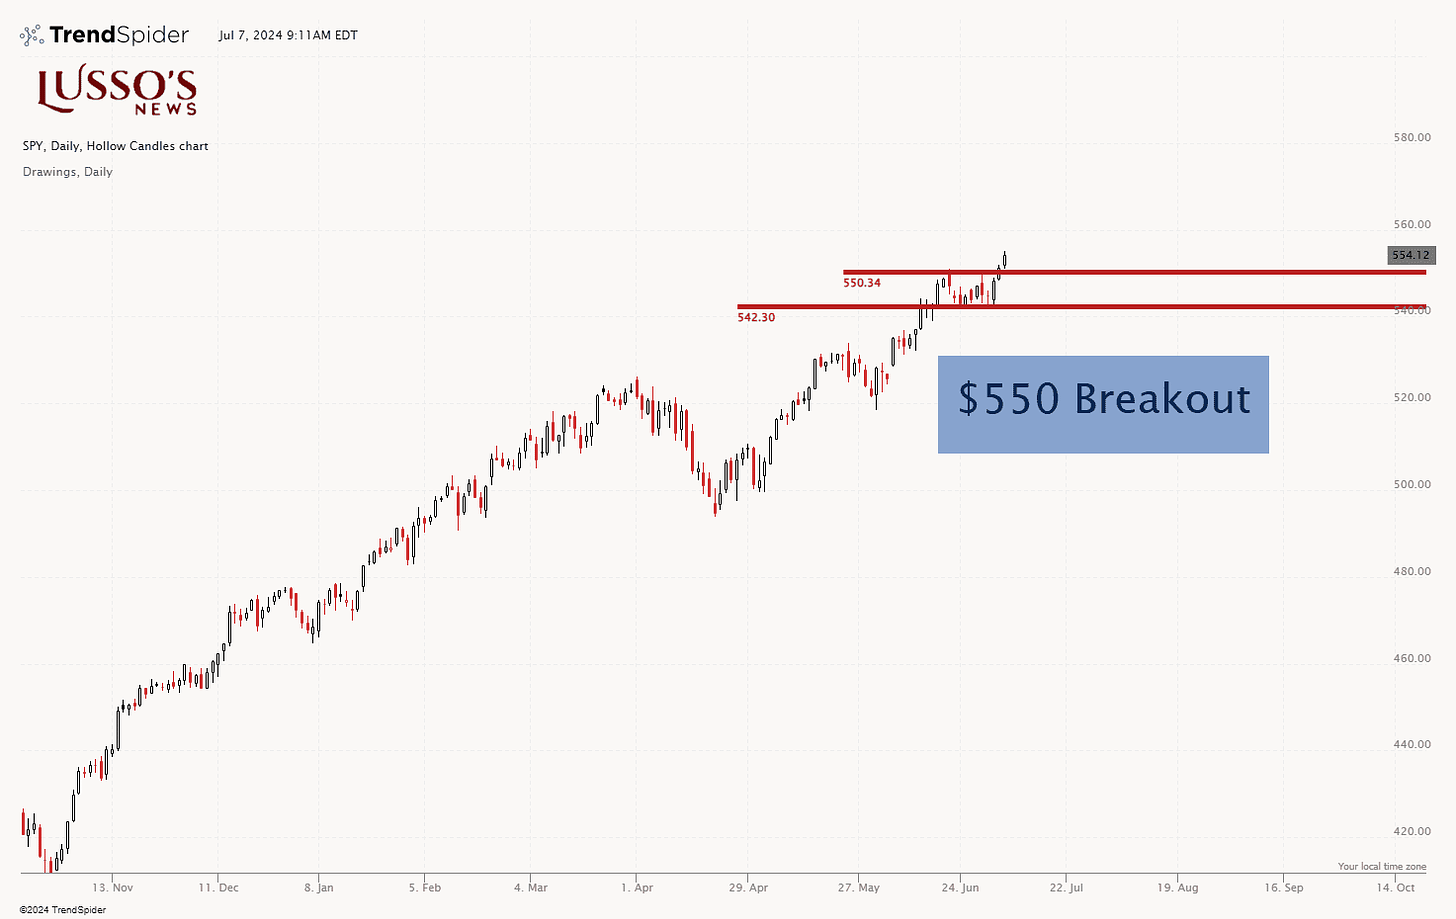
The SPY brokeout strong above the $550 resistance level, indicating strong bullish momentum as the chart confirmed the bullish trend once again.
This breakout is significant as it follows a period of consolidation around the $542.30 level, confirming STRONG buying interest and the potential for continued upward movement.
The recent price action shows us that the bulls are firmly in control, and the path of least resistance is higher.
Keep on watch for the $550 level to become potential new support.
QQQ, NASDAQ
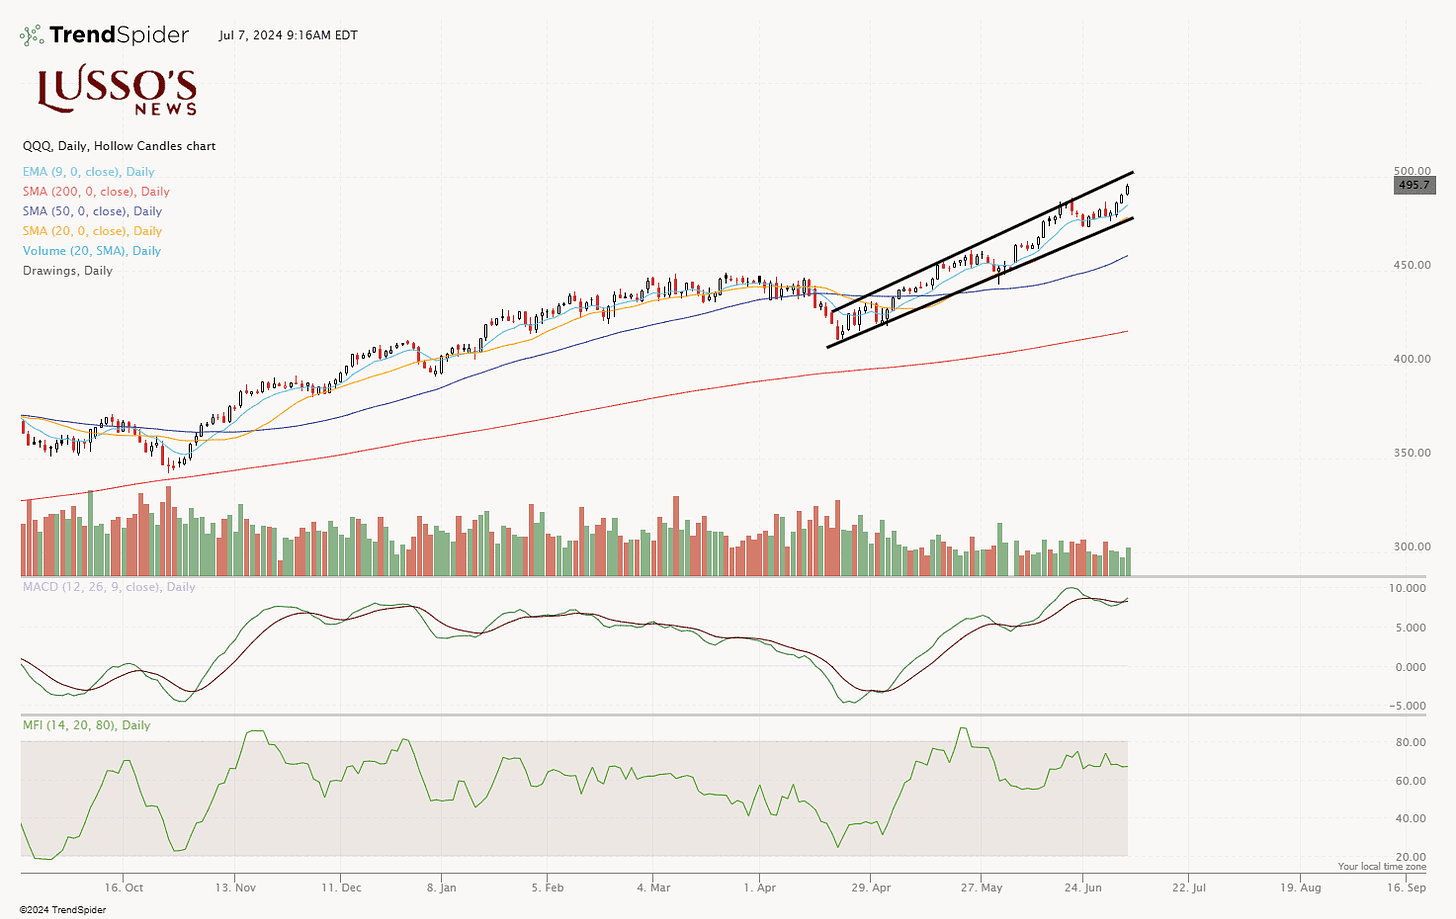
The QQQ chart continues to display a strong uptrend within its ascending channel, with prices consistently trading above the 9 EMA and 20 SMA. This indicates strong bullish momentum and trader confidence.
However, the recent increase in volume on down days suggests some distribution, which warrants attention.
The MACD remains in positive territory, but any signs of bearish divergence could signal a potential weakening in upward momentum. The Money Flow Index (MFI) is currently stable but approaching overbought levels, indicating that a short-term pullback or consolidation phase might be imminent.
Overall, while the trend is positive, we are seeing a lower reward and higher risk trading environment as the QQQ begins to get overbought in the short term and is approaching resistance.
BITCOIN
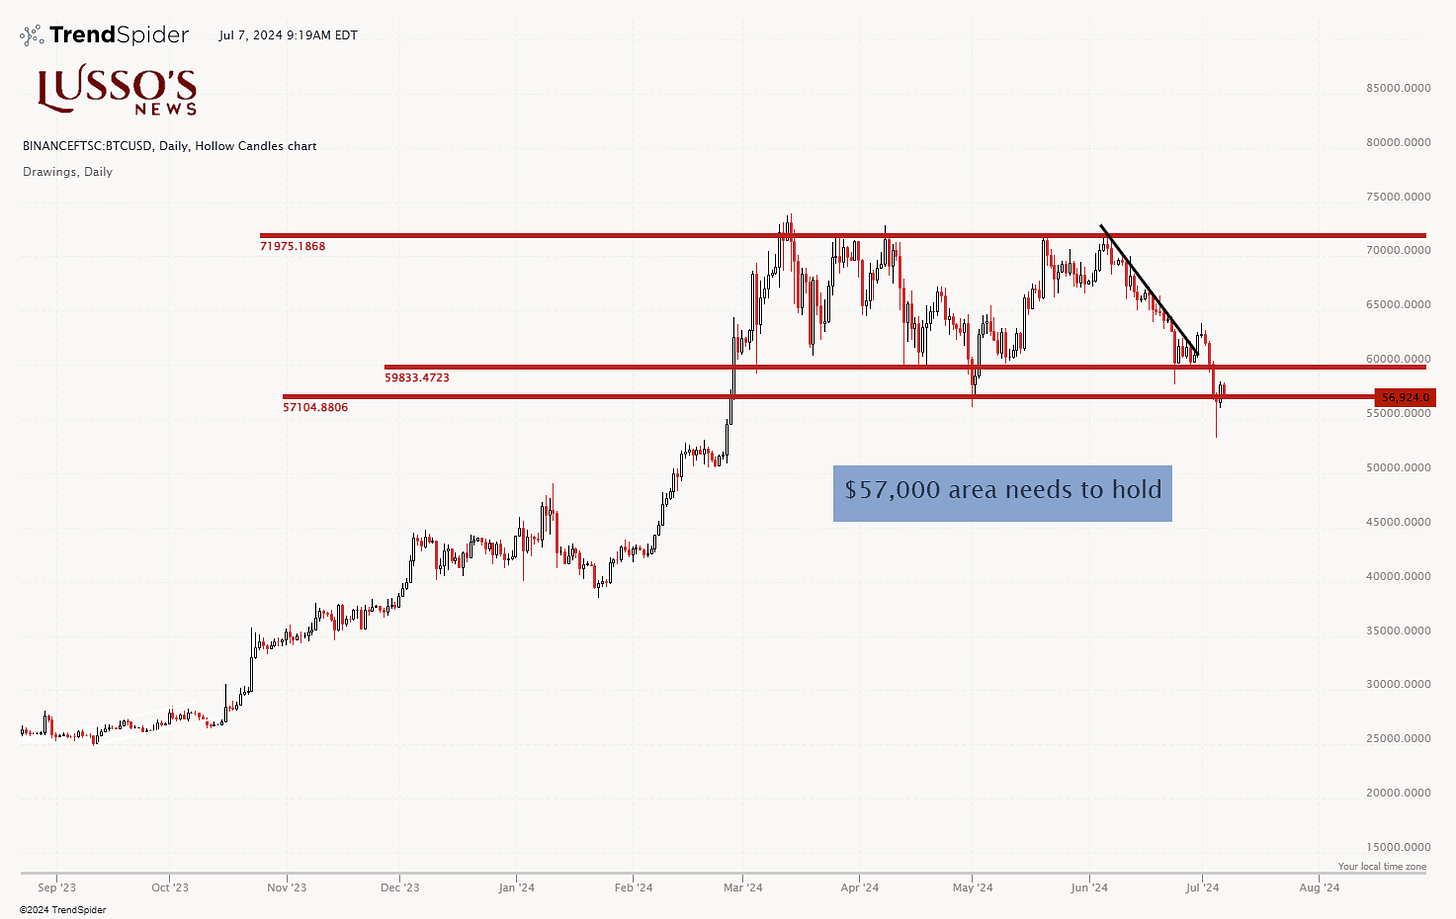
The Bitcoin chart shows a critical chart for bulls, with the price hovering just below the key $57,000 support level. This area is crucial to hold, as a break below it could trigger further downside pressure.
The recent downtrend and subsequent failure to reclaim higher levels show us strong bearish momentum. If the $57,000 support fails, the next significant level to watch is around $53,000.
A move back above $60k would signal weakness from the bears and could cause bulls to step back in. Keep the $60k level on watch.
TLT
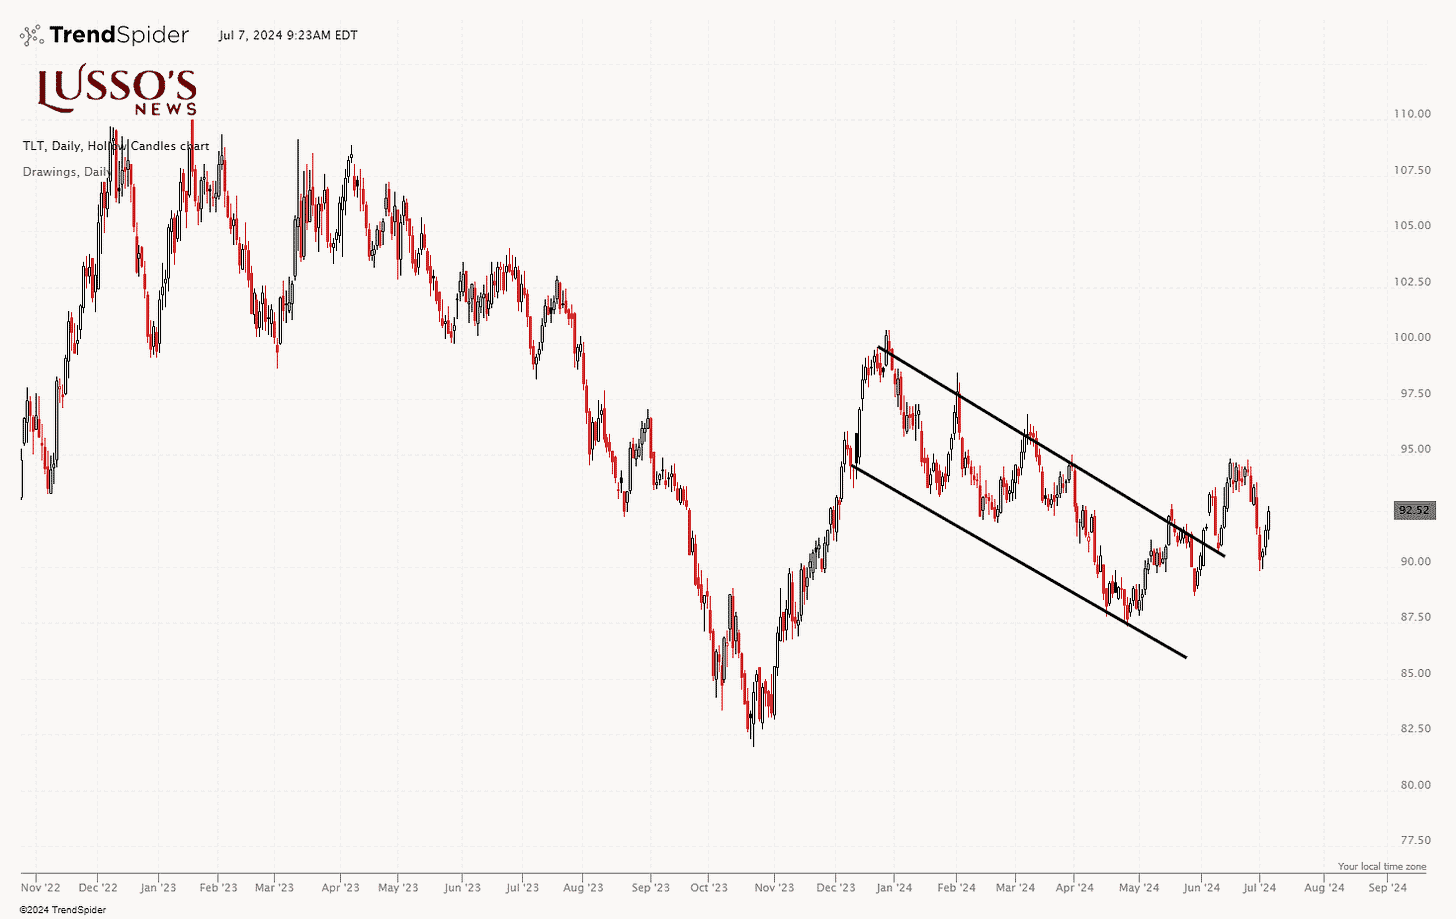
The TLT chart shows a overextended bull flag that is currently in the midst of a potential breakout.
The recent price action shows a trend shift, with prices breaking out of the bull flag pattern but facing resistance near the $95 level.
This suggests a possible shift in sentiment towards bonds, which could indicate stabilizing or falling interest rates. A sustained move above this resistance could signal further upside for TLT, while failure to break higher might result in continued volatility.
This scenario could have broader implications for equities, particularly the NASDAQ and SPY, if bond yields begin to stabilize or decline.
VIX
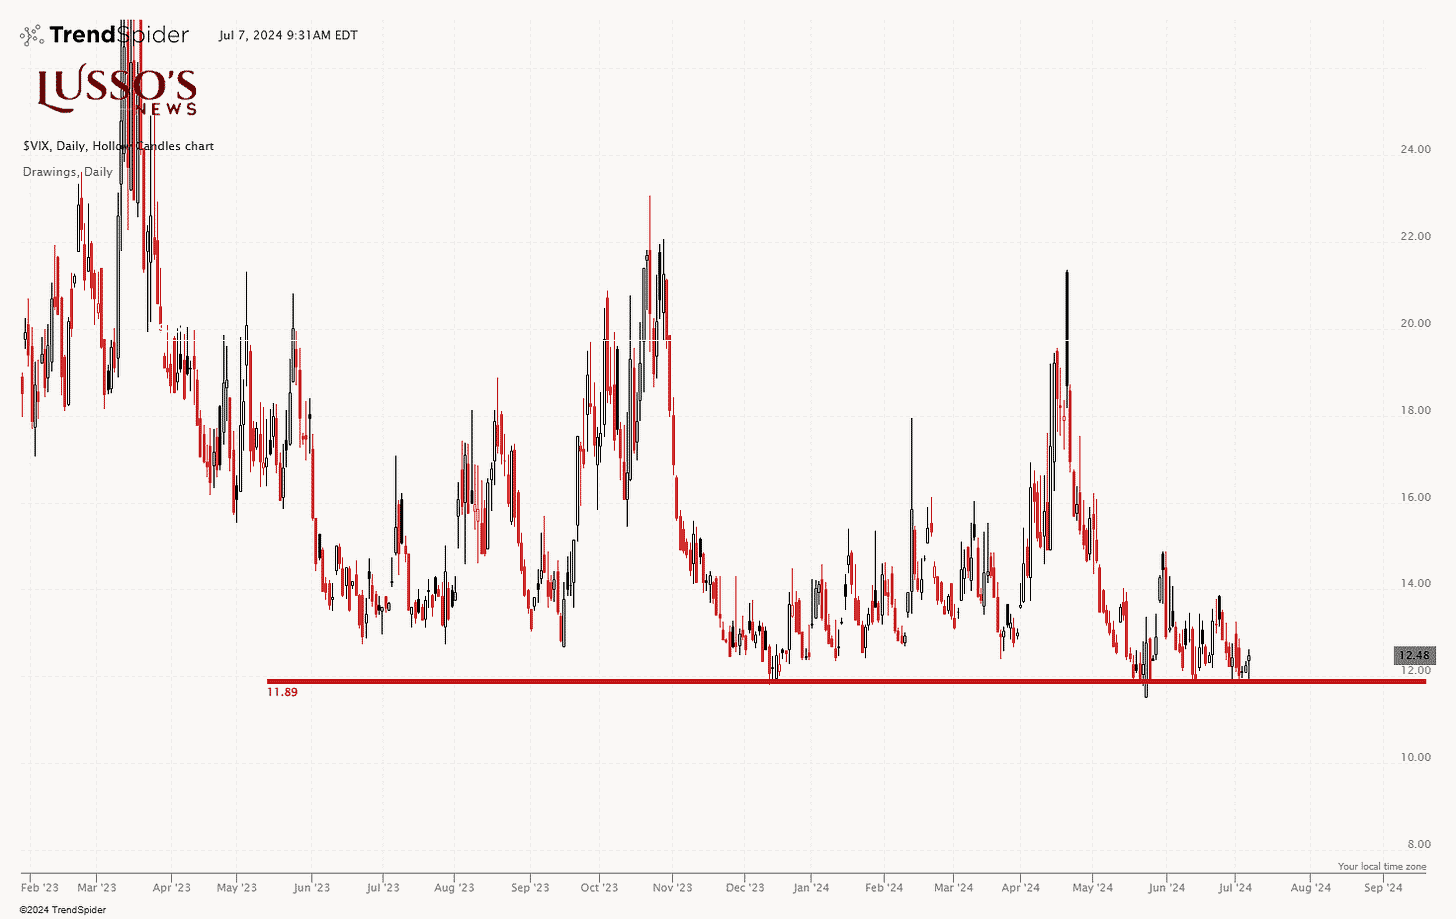
The VIX chart is currently hovering near the 11.89 support level, which shows us a period of low volatility in the market.
This suggests a bullish sentiment among the market, as lower volatility often coincides with rising stock prices.
However, the VIX is known for its mean-reverting nature, and a spike in volatility could be on the horizon if market conditions change.
If the VIX gets above $13 then we can talk about it more and address potential concerns but, for now we do not see concerns.
Market Outlook for the Week
Going into the week, the market shows us a cautiously bullish stance.
The SPY's breakout above $550 and the QQQ's continued strength within its ascending channel indicate positive momentum.
However, the increased selling volume in QQQ and the critical support level for Bitcoin at $57,000 necessitate vigilance.
The TLT's potential stabilization suggests mixed signals about interest rates, while the VIX remains low, signaling low volatility.
Overall, I would rate the market at a 7 out of 10 on the bullish-bearish scale going into the week.
Summary Conclusion
SPY: Breakout above $550 signals strong bullish momentum.
QQQ: Continued uptrend but watch for increased selling volume.
Bitcoin (BTCUSD): Critical support at $57,000; failure to hold could trigger downside.
TLT: Potential stabilization in bonds; mixed signals about interest rates.
VIX: Low volatility, but be cautious of potential spikes.
With a market rating of 7 out of 10, traders should focus on risk management and selective positioning to navigate current conditions effectively.
Disclaimer
Lusso's News Insider is intended for informational purposes only and does not constitute investment advice. The opinions expressed in this report are those of the author and do not necessarily reflect the views of Lusso's News Insider. Trading in financial markets involves significant risk and may not be suitable for all investors. Past performance is not indicative of future results. Before making any investment decisions, it is recommended to consult with a professional financial advisor to ensure that any strategies or investments are appropriate based on your individual circumstances and risk tolerance. Lusso's News Insider assumes no responsibility for any losses or damages resulting from the use of the information contained in this report. Use of this report constitutes acceptance of these terms and conditions.


