🎙️STOCK MARKET CRASH? Market Breadth Report and High-Potential Stocks to Watch!
AUDIO VERSION INCLUDED FOR FREE
HEY TRADERS and VIP MEMBERS!
Today report features:
Audio Version
Market Breadth Analysis and Rating Out Of 10
Stock Pick Selection
Watchlist
Trade Plan
Charts with Commentary
Comments from Wall Street Veteran
Market Breadth Analysis
In this segment we will discuss the overall market conditions.
Is there a bear market underway?
Is this just a one week selling event?
Will we bounce?
By reading/listening to this segment you will gain a understanding of the current market conditions and be able to determine if the probabilities are high or low for traders going into the week.
S&P 500
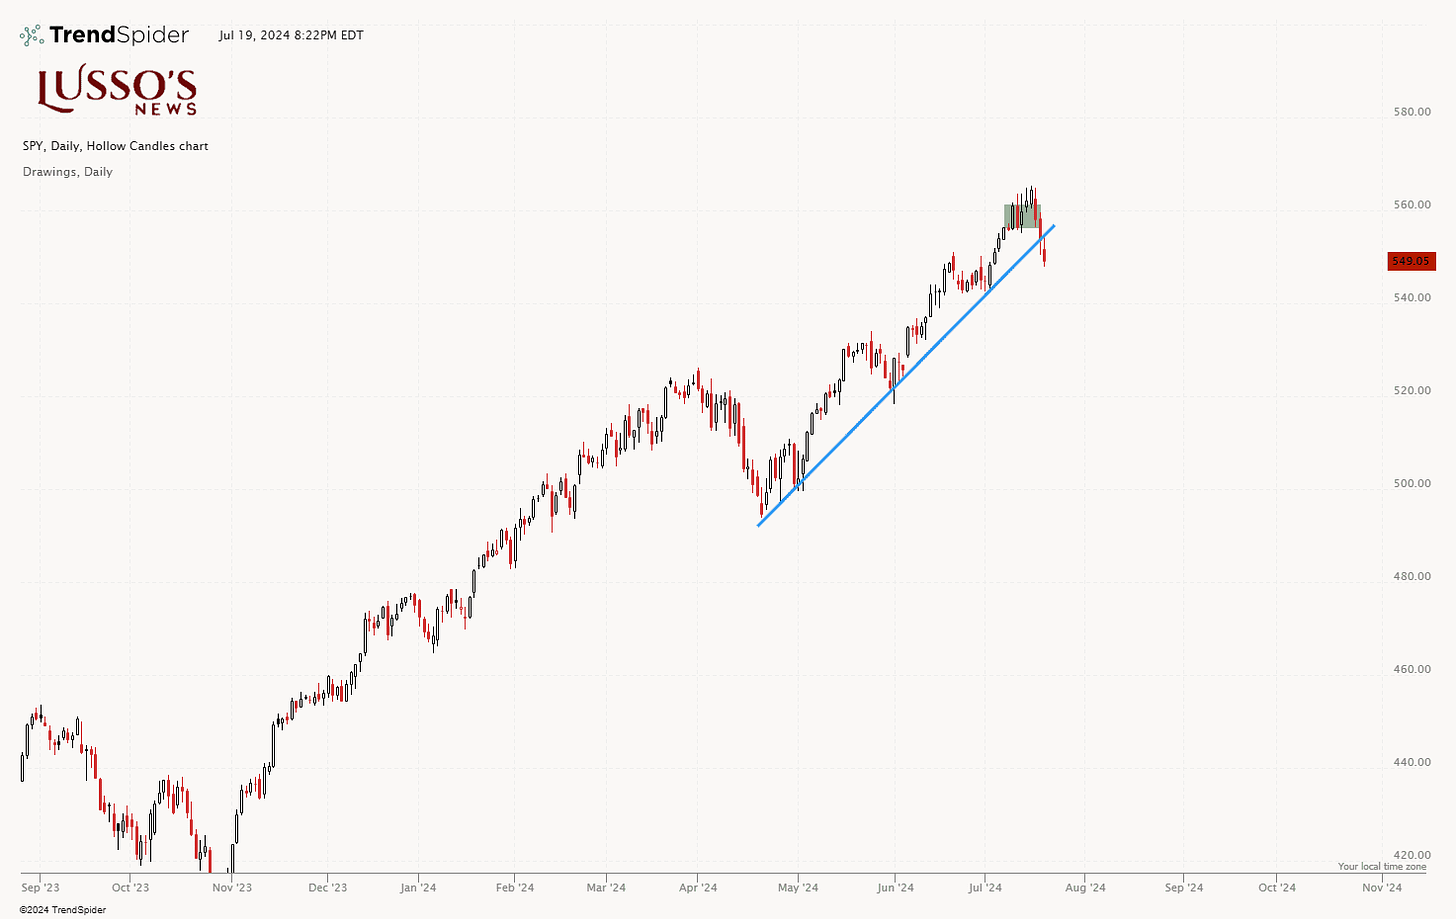
The SPY daily chart shows a strong uptrend since early 2024, characterized by higher highs and higher lows with a sell off at the start of April.
Recently, however, the price has broken below the upward trendline, showing us potential weakness in the current bullish trend.
The fact that this breakdown comes after the market prices in a 100% rate cut in September and it comes after the market hit new highs shows us that the selling as been aggressive and we see reasons to play defense.
QQQ
The QQQ has been lagging behind the S&P 500, and the price is now below key momentum moving averages. The 50-day simple moving average (SMA) is the main level to watch next week. However, as long as the price remains below the short-term moving averages, there are reasons for a defensive stance in the market. This indicates potential further weakness, and traders should stay cautious until a clear support level is established.
TLT
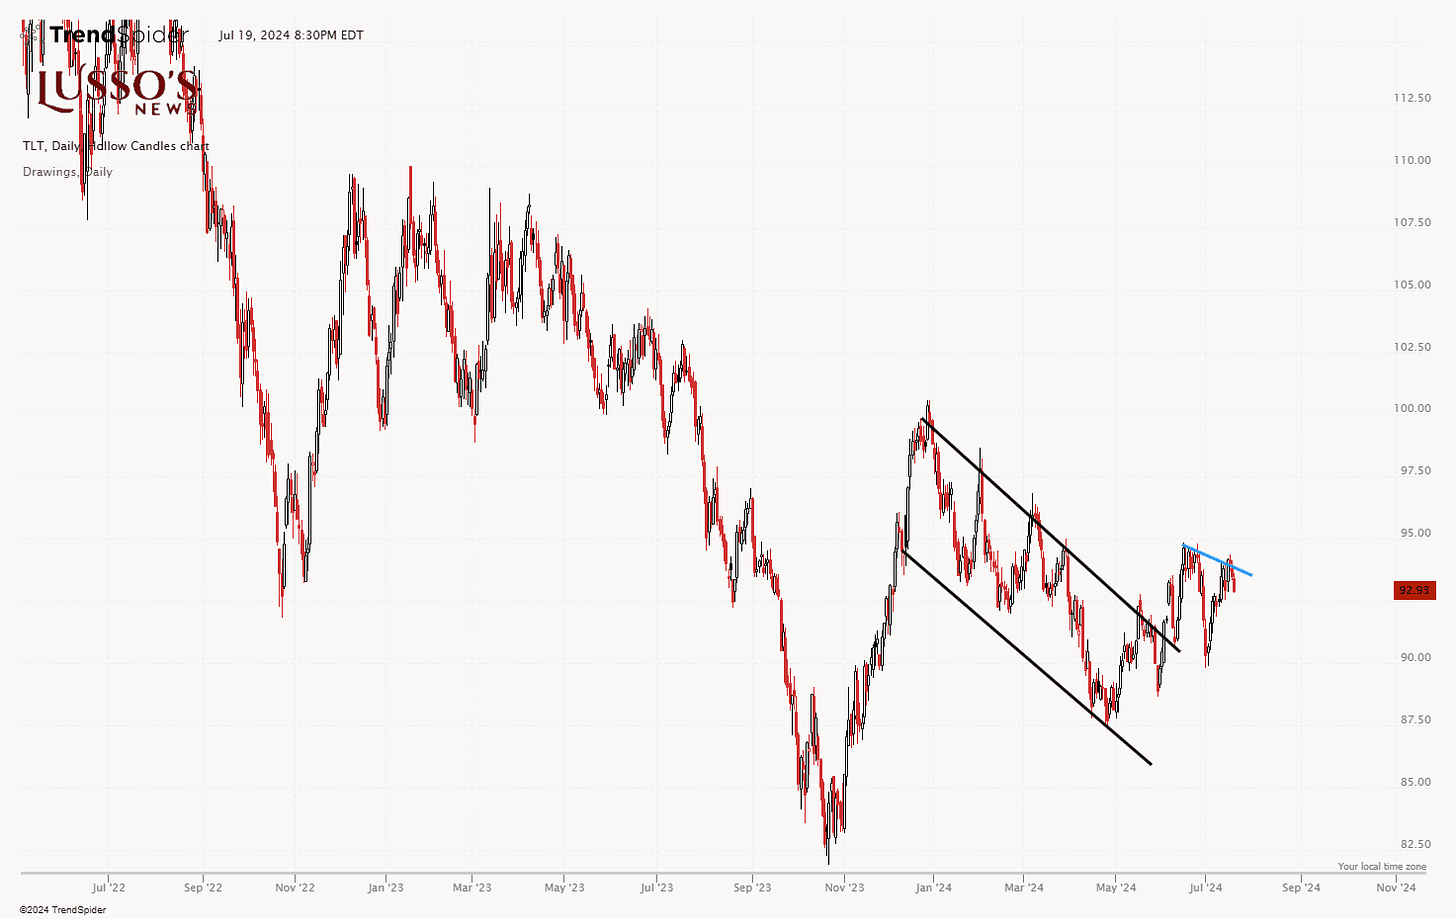
The TLT chart has recently broken out of a downward channel and is trying to gain momentum to the upside. Despite this breakout, the price has encountered resistance near the $95 level and is struggling to maintain upward momentum. Traders should watch for a clear break above this resistance to confirm a bullish reversal, while a failure to break through could lead to continued consolidation or a return to the downtrend.
💡The price movement of TLT, which represents long-term U.S. Treasury bonds, can significantly impact the stock market and individual stocks.
Here are a few key effects:
Interest Rates and Valuations: When TLT prices rise, it often indicates lower long-term interest rates. Lower interest rates can lead to higher stock valuations, as the present value of future earnings increases. Conversely, falling TLT prices can signal higher interest rates, potentially leading to lower stock valuations.
Investor Sentiment: Rising TLT prices can indicate a flight to safety, where investors move their capital from stocks to bonds due to economic uncertainty. This can lead to a decline in stock prices as demand for equities decreases. On the other hand, falling TLT prices might suggest that investors are more confident in the stock market, leading to increased stock buying.
BITCOIN
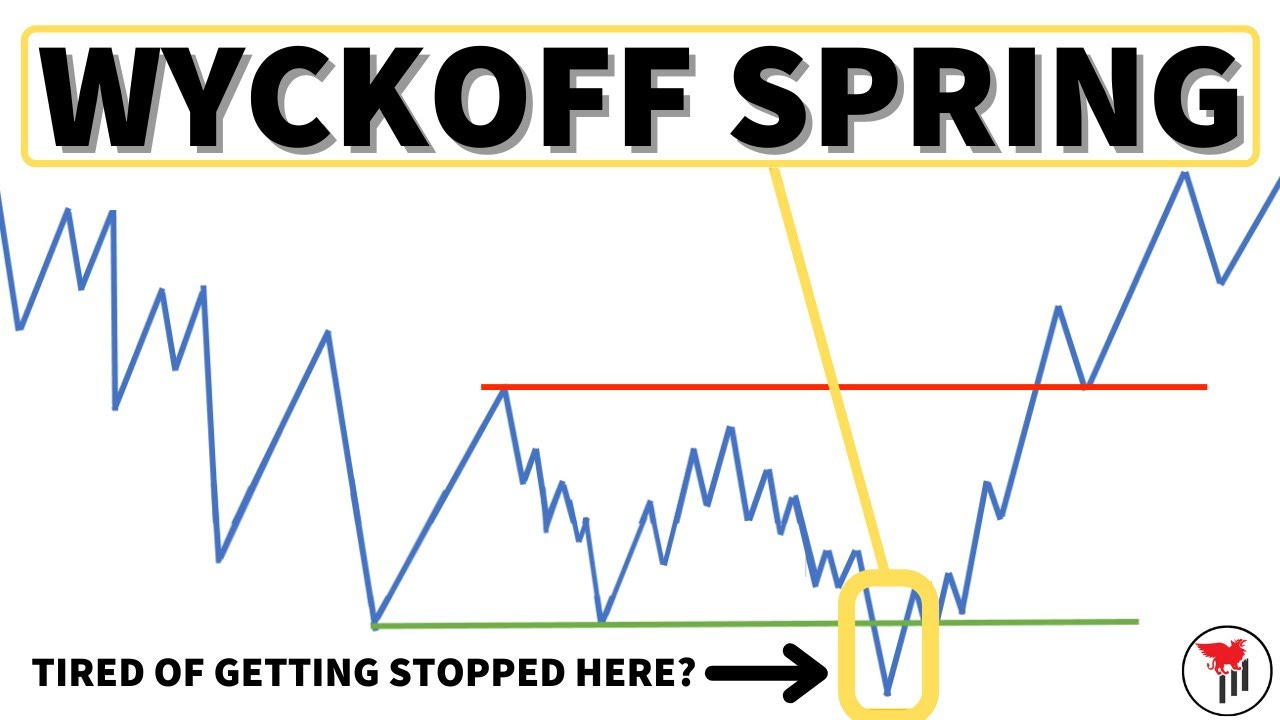
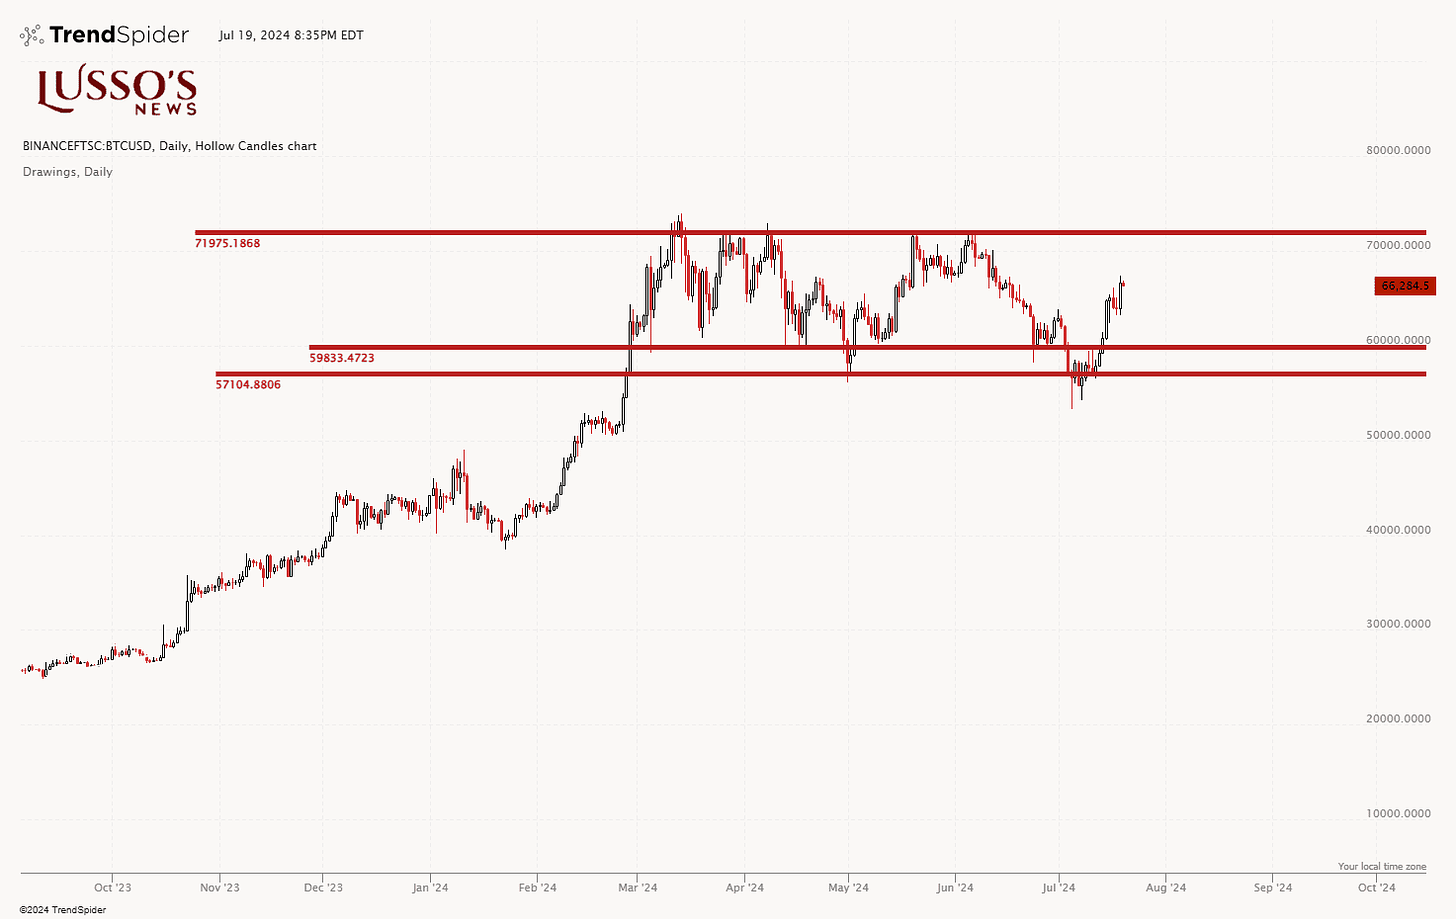
Bitcoin has put in a wyckoff spring pattern which is bullish given the reversal here.
With Trump turning bullish on Bitcoin is could be a catalyst for the breakout to finally happen over the $72,000 mark.
All Bitcoin related stocks are on watch going into next week as this could be looked at a secotr rotation play as the market tries to find a bottom of the recent selling.
Final Take And Market Rating
SPY: The SPY daily chart shows a strong uptrend since early 2024 with a significant sell-off starting in April. Recently, the price has broken below the upward trendline, indicating potential weakness in the bullish trend. Given the aggressive selling after the market priced in a 100% rate cut in September and hitting new highs, there are reasons to adopt a defensive stance.
QQQ: The QQQ has been lagging behind the S&P 500, with the price now below key momentum moving averages. The 50-day SMA is the critical level to watch next week. As long as the price remains below the short-term moving averages, there are reasons to be cautious, indicating potential further weakness.
TLT: TLT has recently broken out of a downward channel but is facing resistance near the $95 level. A clear break above this resistance would confirm a bullish reversal, while failure to break through could lead to consolidation or a return to the downtrend. The movement in TLT can significantly impact interest rates and stock market valuations.
Bitcoin: Bitcoin has formed a Wyckoff spring pattern, suggesting a bullish reversal. With Trump's bullish stance on Bitcoin, it could act as a catalyst for a breakout above the $72,000 mark. Bitcoin-related stocks are on watch for potential sector rotation as the market seeks to find a bottom amid recent selling.
Final Take
Given the current market conditions, the overall sentiment appears cautious. The SPY and QQQ showing potential weakness, and TLT facing resistance, suggest a defensive approach is prudent. However, Bitcoin's bullish pattern and potential catalysts provide some positive outlook.
Market Rating
🚨Rating: 4/10 (Bearish)
Trade Plan for S&P 500
Defensive Stance: Given the recent breakdown below the trendline, focus on preserving capital and avoiding aggressive long positions until further confirmation of support. KEEP RISK LOW. DON’T TRY AND BE A HERO.
Watch Key Levels: Monitor the 50-day SMA as a critical support level. A break below this level on high volume could signal weakness but, low volume could show a bottom.
Selective Buying: If the market shows signs of stabilization or support around key levels, consider selective buying in sectors showing relative strength or benefiting from current market conditions.
Stocks to Watch
In this segment we will discuss stocks on our radar this week and what we are watching. As you can see from our market breadth segment that rating is a 4/10 going into the week which is the lowest rating we have given in 2024.
Caution is warranted but, the market is full of surprised always and we must be prepared.
NVDA 0.00%↑
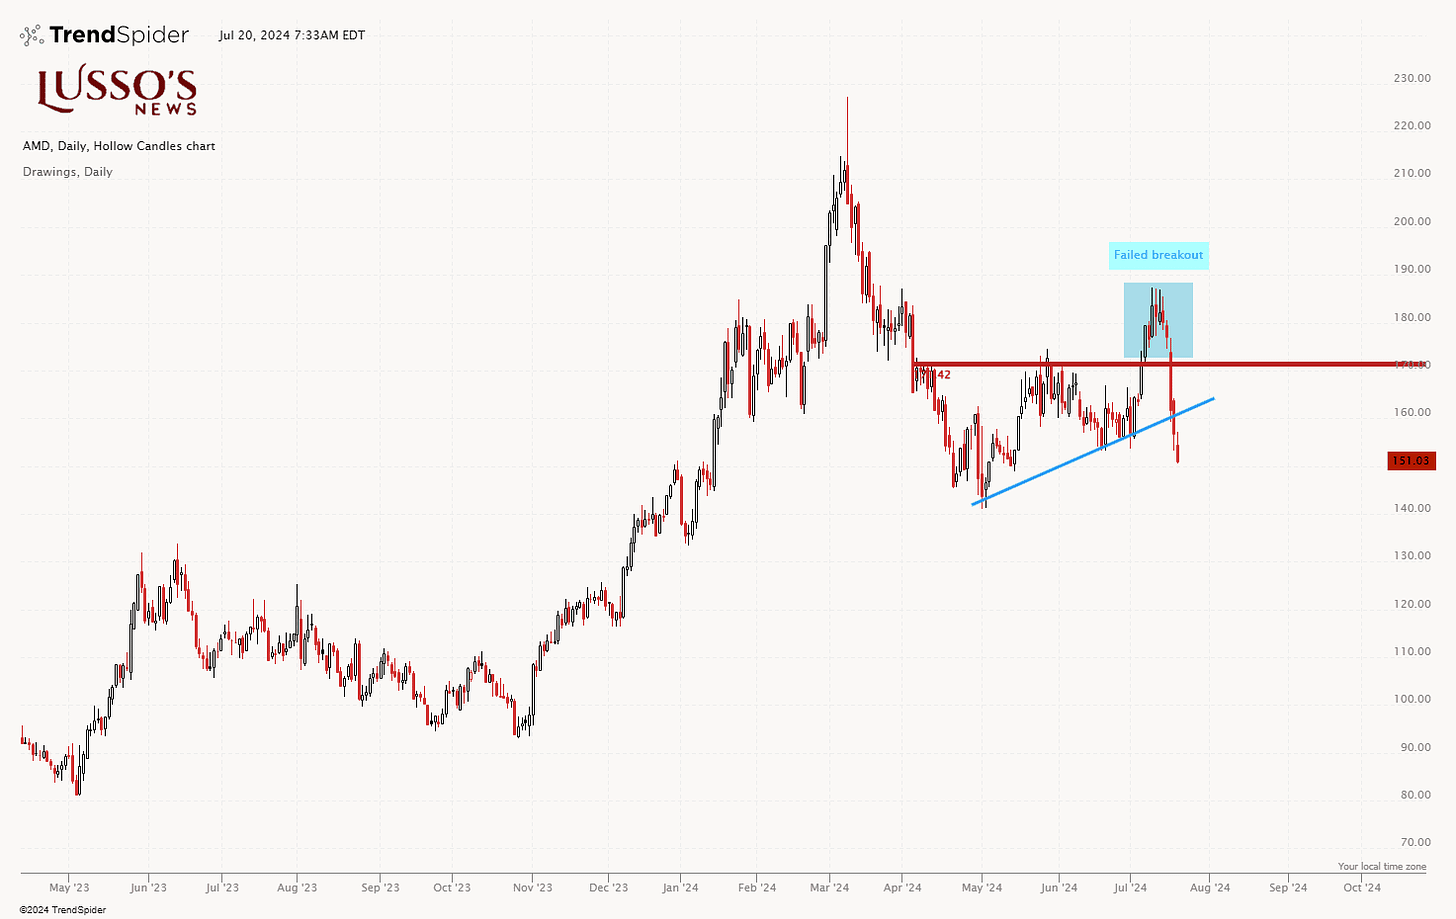
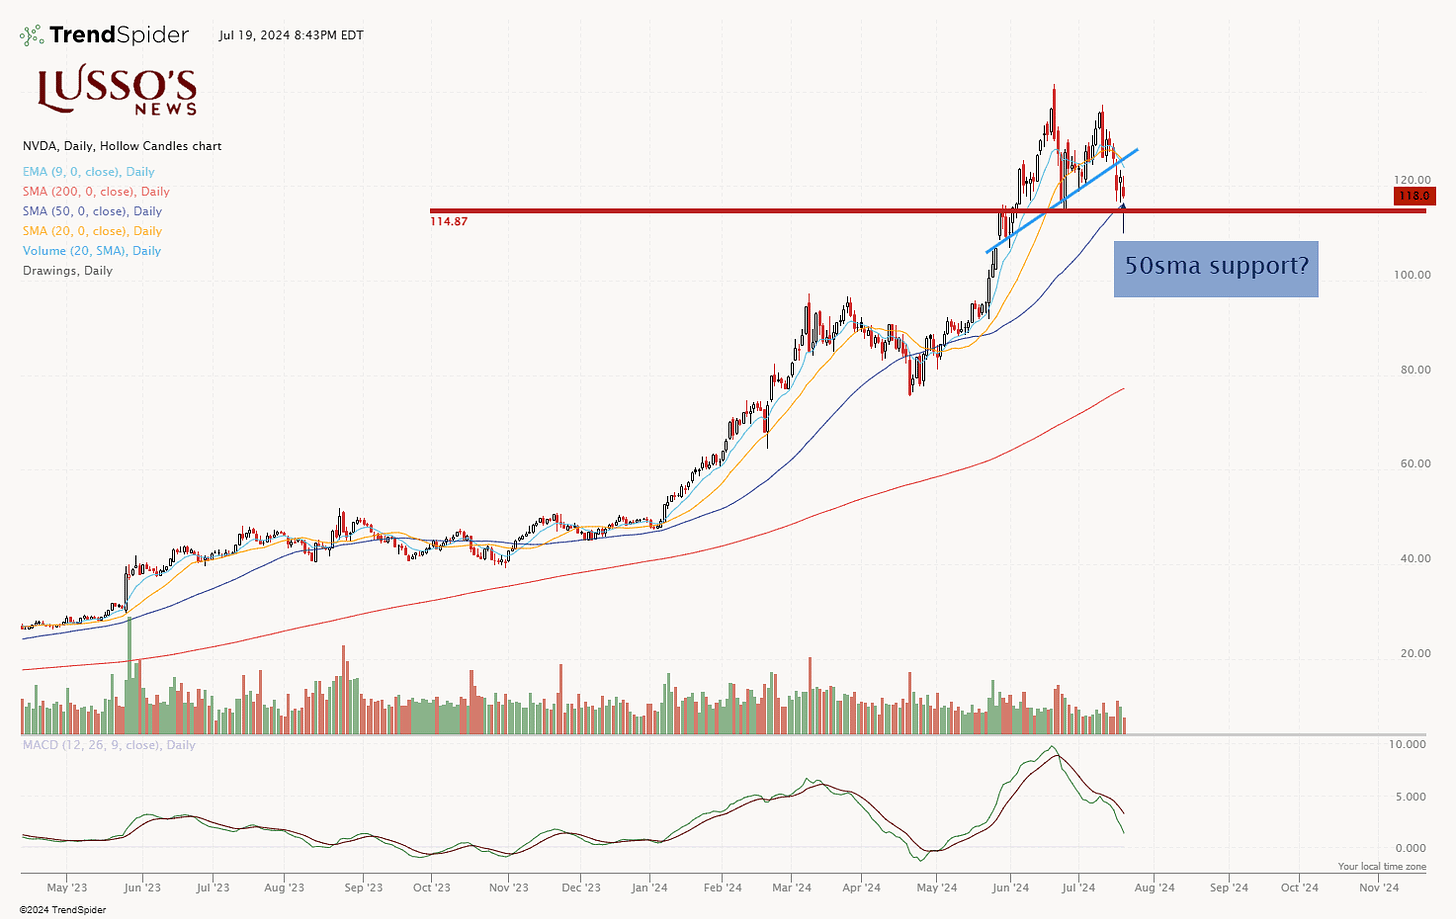
Shares of NVDA brokedown below the trendline last week.
This correlates with AMD breaking down below the trendline as well.
It is worth nothing that AMD is below the 200 day simple moving average for the first time since October of 2023 which could indicate a bear market potential in store for chip stocks.
With this development we want to be very disciplined in our trading.
As for NVDA, it is still above support at around the $115 mark which is price action support on the chart as well as the 50 day simple moving average support.
If we see AMD hold the 200 day simple moving average as support we could try to trade NVDA long but, caution is warranted as the line of least resistance is to the downside right now giving the price is below the 9ema.
LOW 0.00%↑
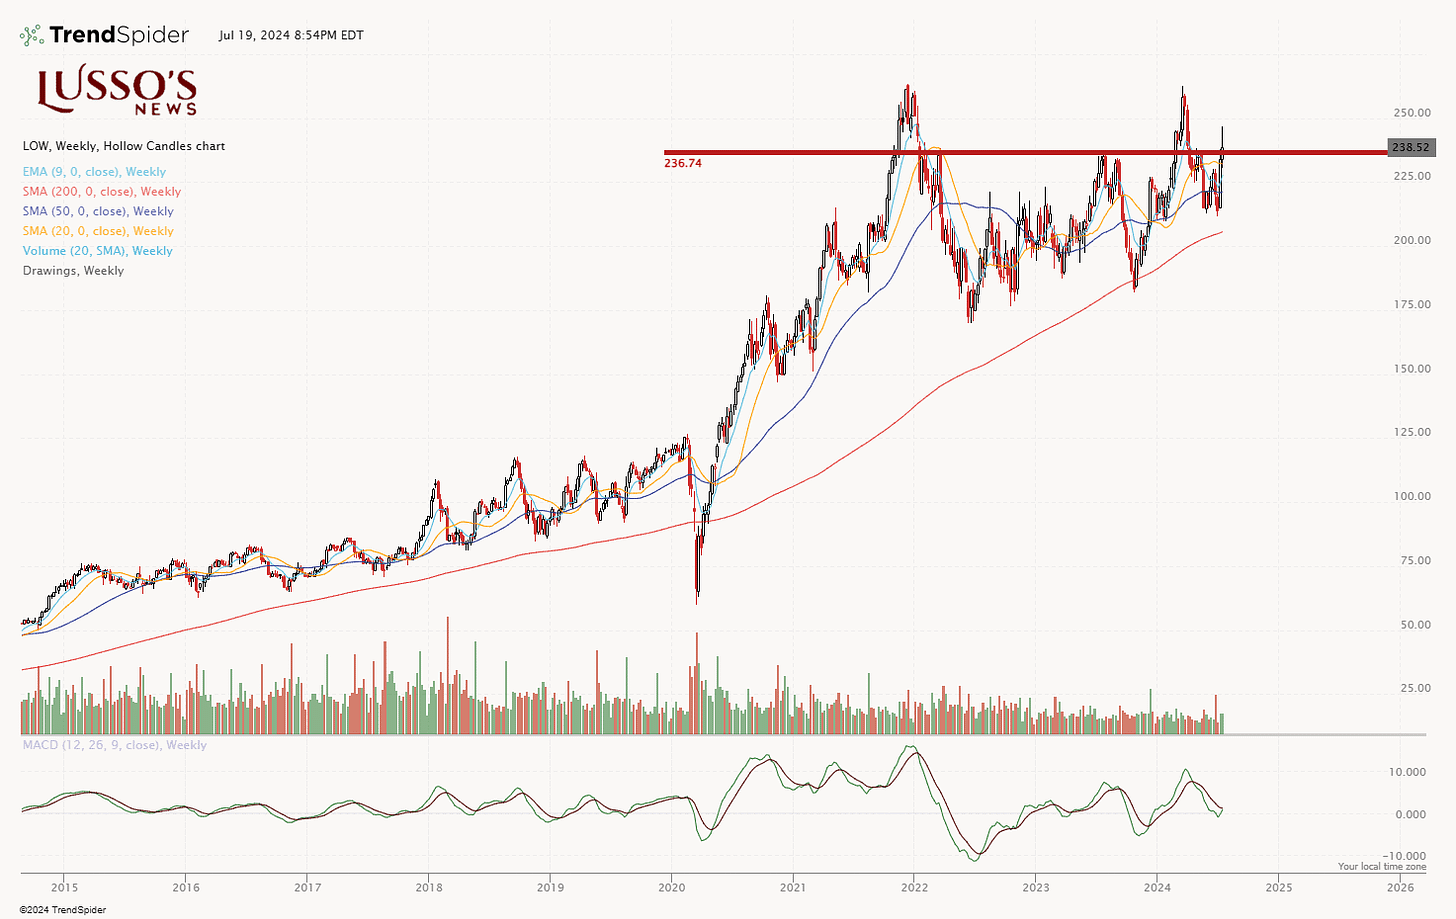
We traded LOW heavily back in 2020 and 2021 and it caught my eye this weekend due to the ability for it to close green on the weekly candle despite mafrket weakness.
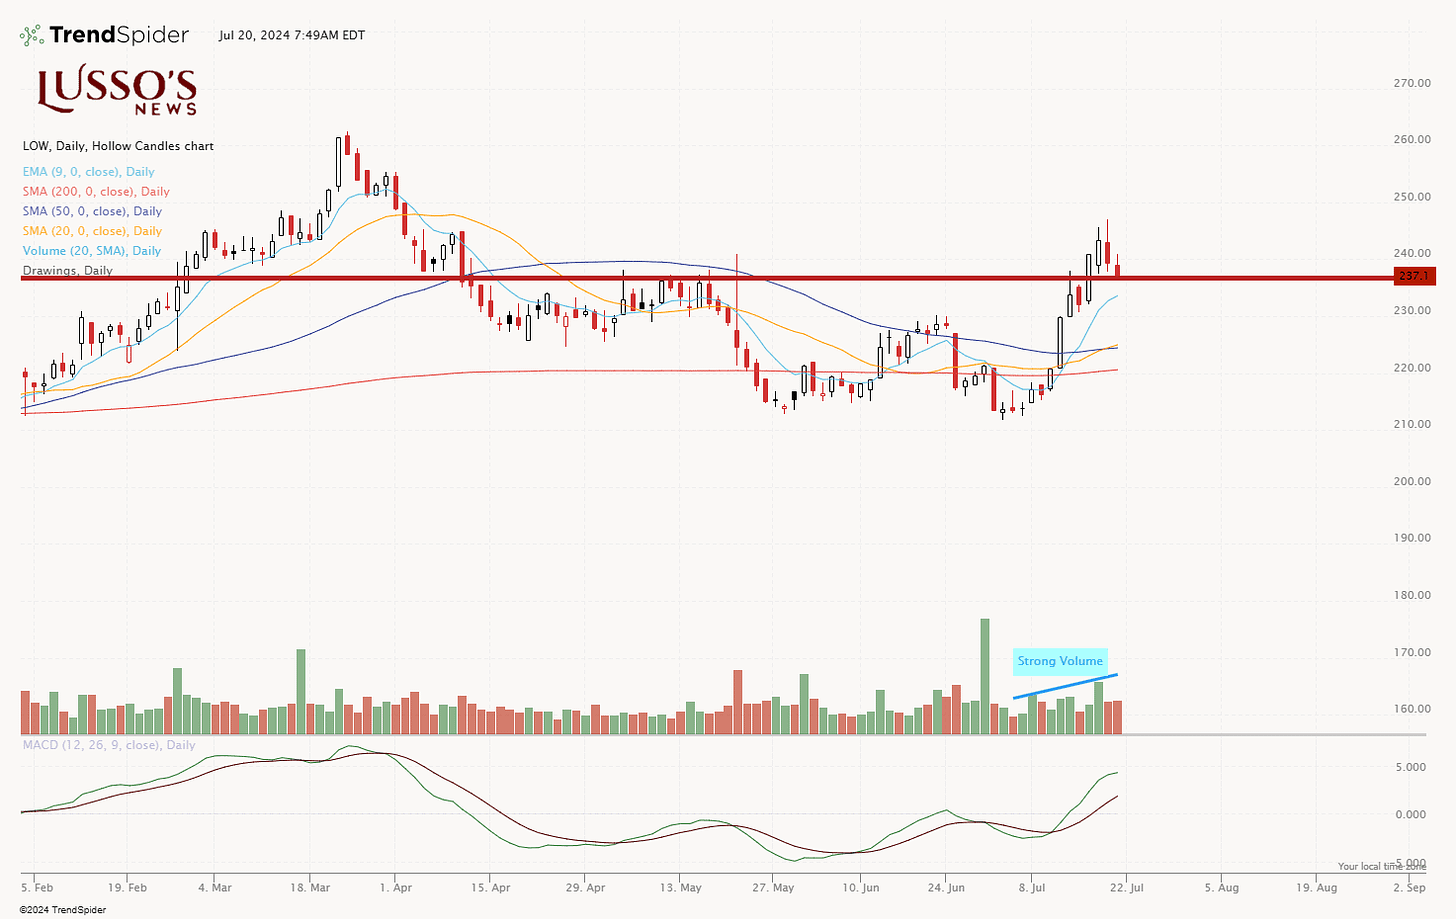
As you can see it recently failed a breakout back at the start of the year where it came crashing down from $250 to the lower $200s but, now the breakout appears to be back on and I am watching this to see if we can get a test of $250.
On the daily chart we can see that the shorter term moving averages are above the longer term moving averages which is healthy.
We can also see that the volume increased with buying on the move to the upside which is very ideal.
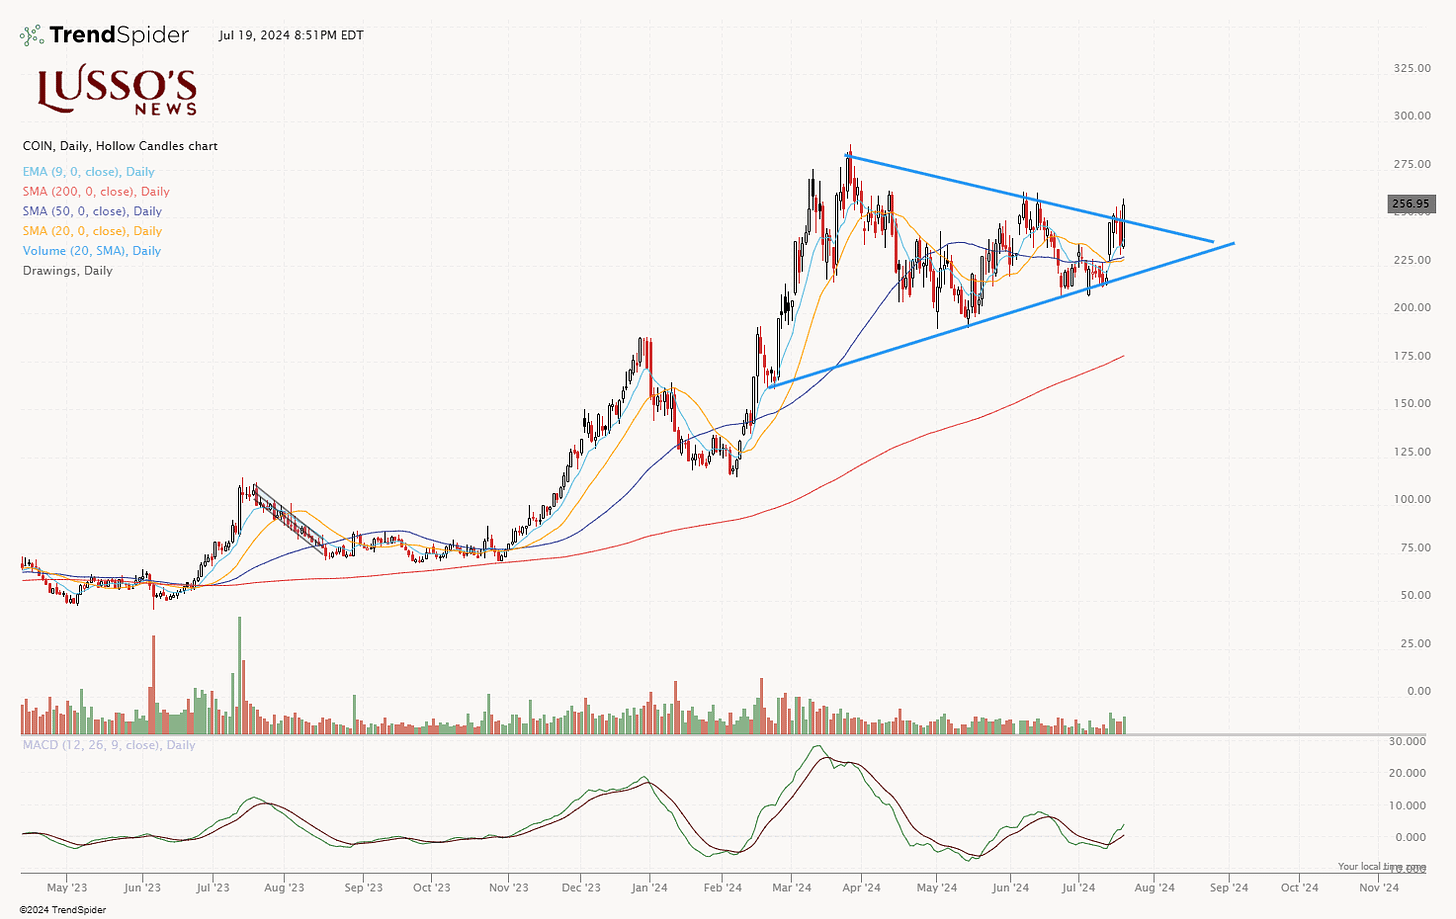
COIN 0.00%↑
As you saw in our market breadth segement, Bitcoin has turned bullish again with buying pressure coming back into it.
With a strong Bitcoin it is only right to look at crypto related stocks and no better stock to look at than Coinbase.
After a strong move to the upside at the start of 2024, COIN has pulled back and started a bull flag.
Last week…COIN brokeout of this flag pattern to end the week making it a must watch stock for this coming week to see if the breakout continues.
COIN has a strong history of running and moving in a volatile manner and with that being said, it deserves to be added to our watchlist for Monday for a continued momentum trade.
SQ 0.00%↑
SQ recently brokeout on encouraging volume and we are seeing momentum start to come back into this name after large selling in 2024.
The 20 day siomple moving average is nearing a bullish convergence of the 50sma and 200sma. If SQ can hold this current level of around $68 then we could look here for a momentum trade this week.
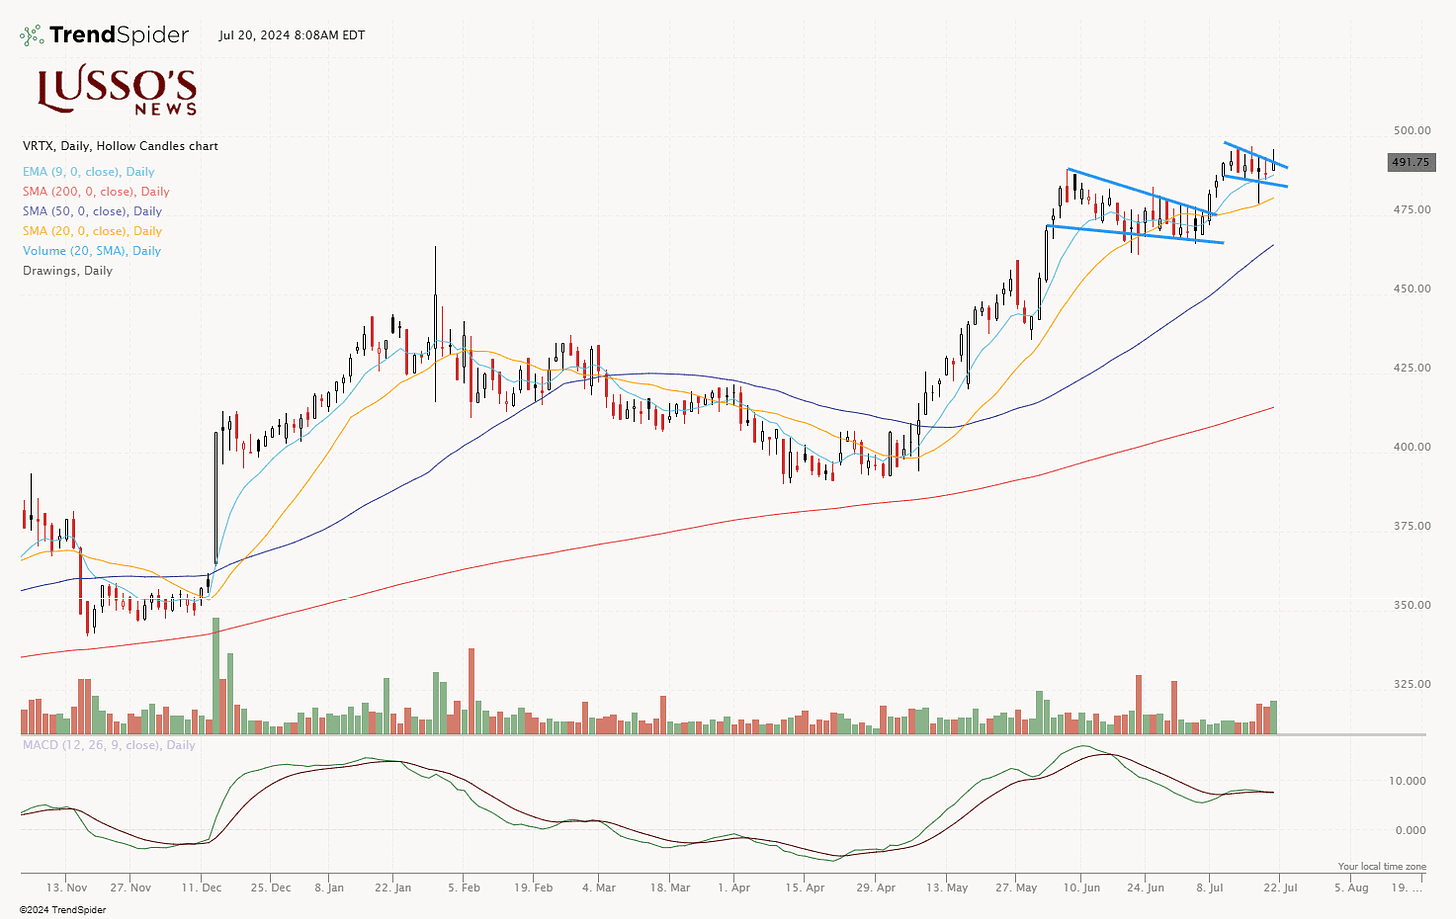
VRTX 0.00%↑
Our old friend VRTX is back in play as a bullflaf breakout for a test of $500 is in play.
Watchlist for Traders Going into the Week
1. NVIDIA (NVDA)
Trend: Recently broke down below the trendline.
Support Levels: Still above support at around the $115 mark, coinciding with the 50-day SMA.
Trade Plan: Monitor for a potential bounce off support. If AMD holds its 200-day SMA, consider a cautious long position in NVDA. However, remain cautious as the short-term trend indicates potential downside with the price below the 9EMA.
2. Lowe's Companies, Inc. (LOW)
Trend: Closed green on the weekly candle despite market weakness.
Key Levels: Failed breakout earlier in the year from $250 to the lower $200s; potential for a retest of $250.
Volume: Increased buying volume on the move to the upside.
Trade Plan: Watch for a continuation of the breakout. Healthy moving average alignment supports the bullish case. Look for a test of the $250 level.
3. Coinbase Global, Inc. (COIN)
Trend: Formed a bull flag and broke out last week.
Bitcoin Correlation: Benefiting from bullish momentum in Bitcoin.
Trade Plan: Monitor for continued breakout momentum. Given COIN's history of volatility, it’s a prime candidate for momentum trades this week.
4. Block, Inc. (SQ)
Trend: Broke out on encouraging volume.
Moving Averages: 20-day SMA nearing a bullish convergence with the 50SMA and 200SMA.
Trade Plan: If SQ holds the current level around $68, look for momentum trades. The convergence of moving averages suggests a potential bullish move.
5. Vertex Pharmaceuticals (VRTX)
Trend: In play as a bull flag breakout.
Target: Testing the $500 level.
Trade Plan: Watch for continuation of the breakout pattern. A successful test of $500 could lead to further upside.
"It’s not whether you’re right or wrong that’s important, but how much money you make when you’re right and how much you lose when you’re wrong." — George Soros
Market Breadth Rating and Approach for the Week
Given our analysis, the market breadth rating going into the week is a cautious 4/10 (Bearish). This rating reflects the observed weaknesses in key indices and the need for a defensive trading approach. The breakdowns in both the SPY and QQQ charts, along with resistance struggles in TLT and the bullish but uncertain sentiment in Bitcoin, all contribute to this cautious stance.
Summary of S&P 500 Analysis
The SPY daily chart shows a strong uptrend since early 2024, characterized by higher highs and higher lows with a significant sell-off starting in April. Recently, however, the price has broken below the upward trendline, indicating potential weakness in the bullish trend. Given the aggressive selling after the market priced in a 100% rate cut in September and hitting new highs, there are reasons to adopt a defensive stance.
Trade Plan for the S&P 500
Defensive Stance: Focus on preserving capital and avoiding aggressive long positions until further confirmation of support. Keep risk low and avoid trying to be a hero in uncertain market conditions.
Watch Key Levels: Monitor the 50-day SMA as a critical support level. A break below this level on high volume could signal further weakness, while a break on low volume might suggest a potential bottom.
Final Thoughts
Caution is warranted as we head into the week, but the market is always full of surprises. Staying disciplined and prepared for various scenarios will be key to navigating the current market environment. Keep an eye on the watchlist stocks and the critical support and resistance levels highlighted in our analysis.
Question Segment
Question 1: So on Monday, given the price of the QQQ and SPY are below the 9EMA, should I sit on my hands or look to trade? What should I do?
Answer: Given that both the QQQ and SPY are currently trading below their 9EMA, the market is showing signs of weakness. A defensive approach is what I will be taking.
Question 2: If I buy NVDA here despite weakness in the stock and in the market, would it be a good trade given I am risking a little with the 50SMA as my stop loss? Or is there a better strategy or approach?
Answer:Buying NVDA in the current market environment, despite its weakness, can be a potential strategy if managed if you trade with small size or have the discipline to stop out.
MY APPROACH…
Wait for a Confirmation Signal: Instead of buying immediately, consider waiting for a confirmation signal such as a bounce off the 50SMA with increased volume or a reversal pattern indicating a potential upward move. This can improve the probability of a successful trade.
DISCLAIMER: Lusso’s News LLC offers no guarantees and provides forward-looking statements with the sole purpose of offering personal enjoyment and entertainment to its readers and viewers. If you choose to purchase any securities mentioned in our articles, posts, newsletters, or comments, you agree to hold Lussosnews.Com, Powerhouse.substack.com, Lusso’s News, LLC and all of the authors free and harmless from any liability. Investing in financial markets is risky, and you may lose your entire investment at any time. Lusso’s News, LLC never guarantees or offers recommendations, and the company will not be responsible for any loss or damage that occurs.
We want to emphasize that we have a strict refund policy, and we do not offer personalized investment advice. Our products and services are for educational and informational purposes only and should not be construed as a securities-related offer or solicitation. We highly recommend that you consult a licensed or registered professional before making any investment decision. Please be aware that Lusso’s News, LLC and its owners or employees are not registered as a securities broker-dealer, broker, investment advisor (IA), or IA representative with any regulatory authority. We do not give out advice, and our publication is solely for information and education.
We want to make it clear that our information is subject to our terms and conditions and disclaimer. Our report is for informational purposes only and is not a buy or sell investment or trade advice. No specific outcome or profit is guaranteed, and the full risk of losing money on a trade applies. Please understand that our writers and traders are not licensed or financial advisors.


