Market Pulse: Strategic Trading Insights for the Week Ahead
A Trade Plan For The Week, Audio Included
Hey Traders and VIP Members!
Today we are talking about the market breadth as we see some areas that could raise probabilities for BEARS.
This Report features:
Audio Version
Charts with commentary
Market Breadth Analysis
Trade Plan for Gold, Silver, QQQ and SPY
Market Breadth Analysis
SPY
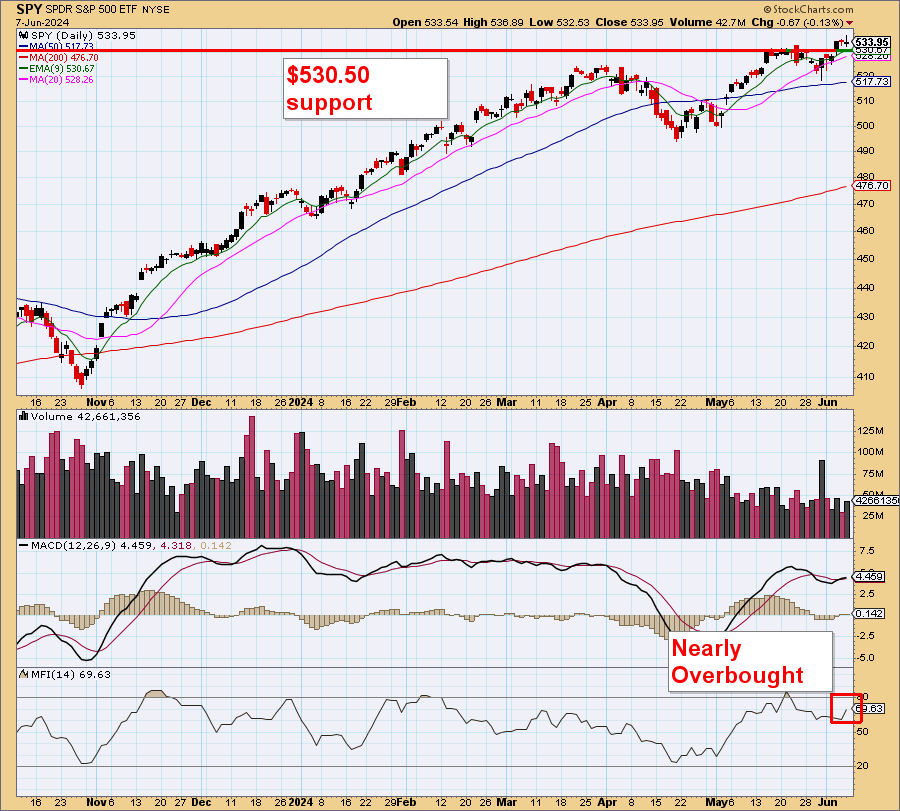
Lets look at the SPY daily chart. This chart indicates strong bullish momentum, with prices consistently above key moving averages (50-day and 200-day). However, the MACD histogram shows signs of diminishing momentum, suggesting potential consolidation or a minor pullback. As well, the Money Flow Index (MFI) is approaching overbought territory, signaling caution for potential short-term traders.
The SPY is due for a pullback to at least $530 in my opinion.
QQQ
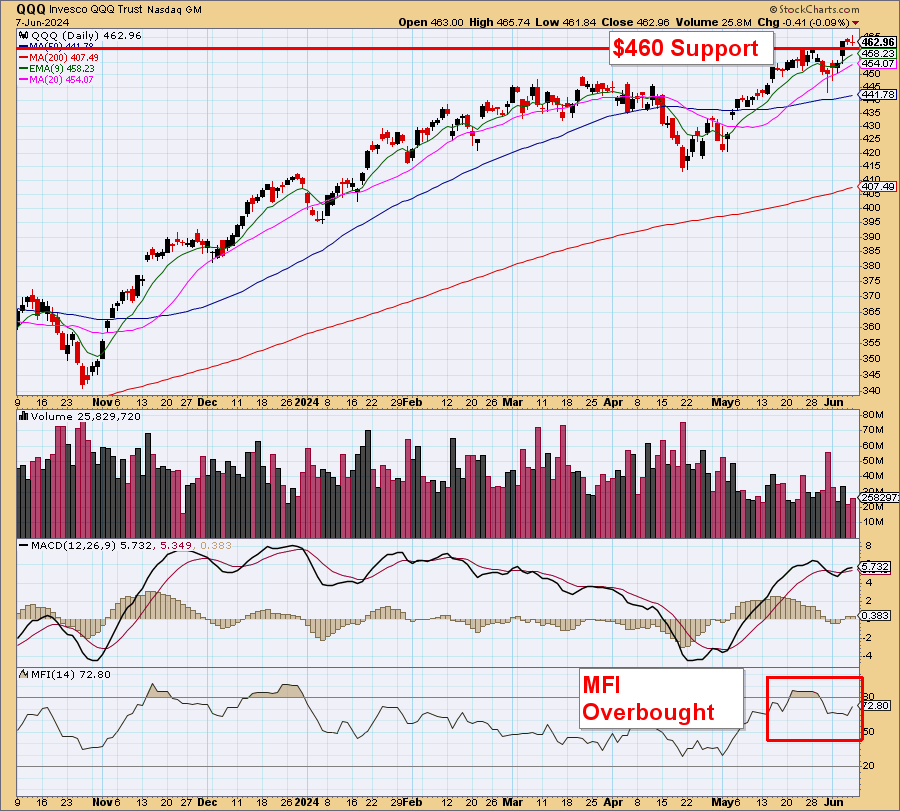
The QQQ chart demonstrates strong bullish activity with prices well above the 50-day and 200-day moving averages, indicating sustained upward momentum.
The MACD histogram is positive but shows a slight divergence, hinting at possible consolidation. Last, the Money Flow Index (MFI) is in overbought territory, which could signal a potential near-term pullback or correction.
Once again, I think the QQQ can see a pullback here. We seen meme stocks crash, Gold and Silver crash and with the Nvidia split it could cause a correction period for the QQQ and SPY.
DXY, US Dollar
The weekly USD chart indicates a potential bullish trend as it attempts to break above the $105 resistance level, which could increase bearish probabilities for QQQ. The RSI remains neutral, suggesting that there is room for further upside movement. The MACD shows a slight bullish crossover, supporting the case for a potential rally in USD, which could put downward pressure on QQQ due to the inverse correlation often seen between the USD and tech-heavy indices.
BITCOIN
MY FAVORITE SET UP!
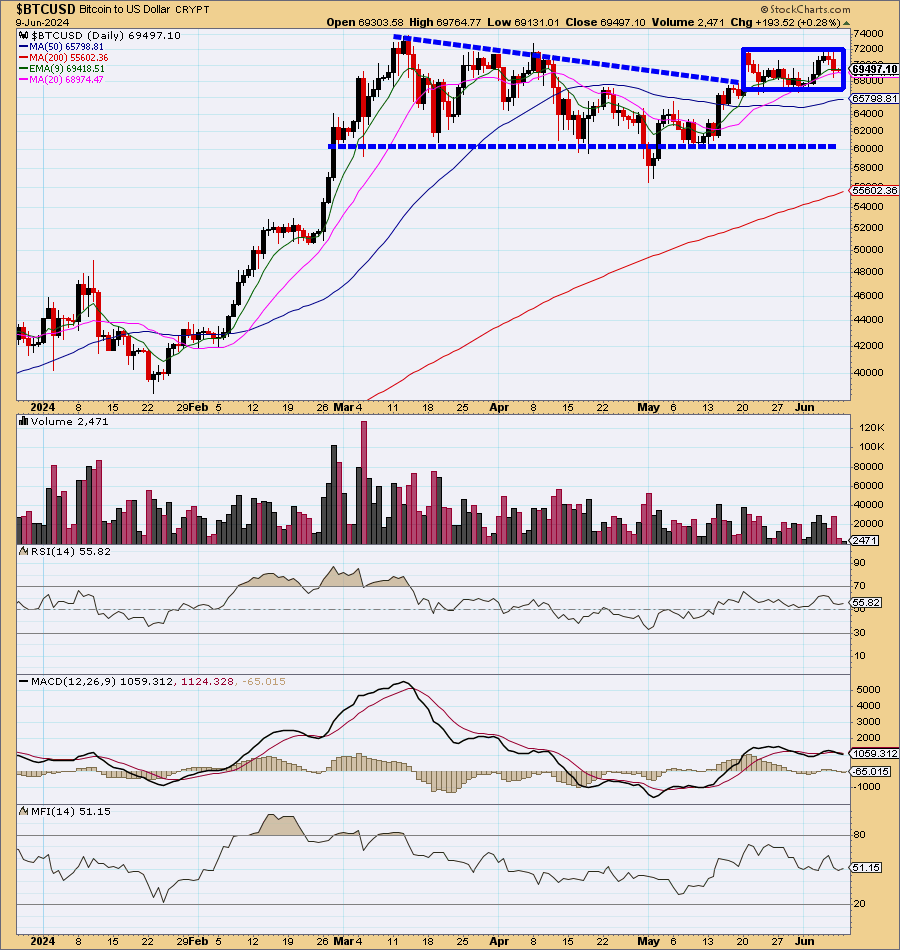
The BTC/USD chart shows a bullish breakout from a descending triangle pattern, suggesting potential for further upward movement.
The RSI is in a neutral position, indicating there is room for the rally to continue without immediate overbought concerns. The MACD histogram has turned positive, confirming bullish momentum, while the MFI remains balanced, suggesting steady buying pressure without significant risk of a reversal at this point.
I think all bitcoin stocks should be on the watchlist this week.
10 year treasury
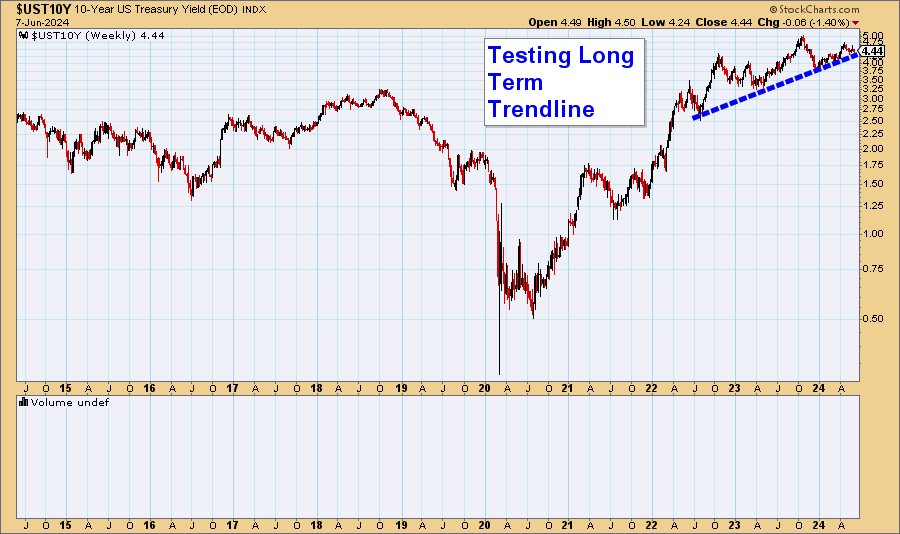
The 10-Year US Treasury Yield chart shows a consistent upward trend since mid-2020, currently testing a long-term trendline. A move below this trendline could cause the NASDAQ to fly but, a bounce here could put pressure on stocks.
GOLD
The GOLD chart shows a critical support level at $2300, with a move below this level potentially signaling a bearish trend. The RSI is currently neutral but leaning towards bearish territory, indicating waning momentum. The MACD shows a bearish crossover, suggesting increasing downside pressure, while the MFI indicates reduced buying pressure, further supporting a cautious outlook if prices break below the $2300 support level.
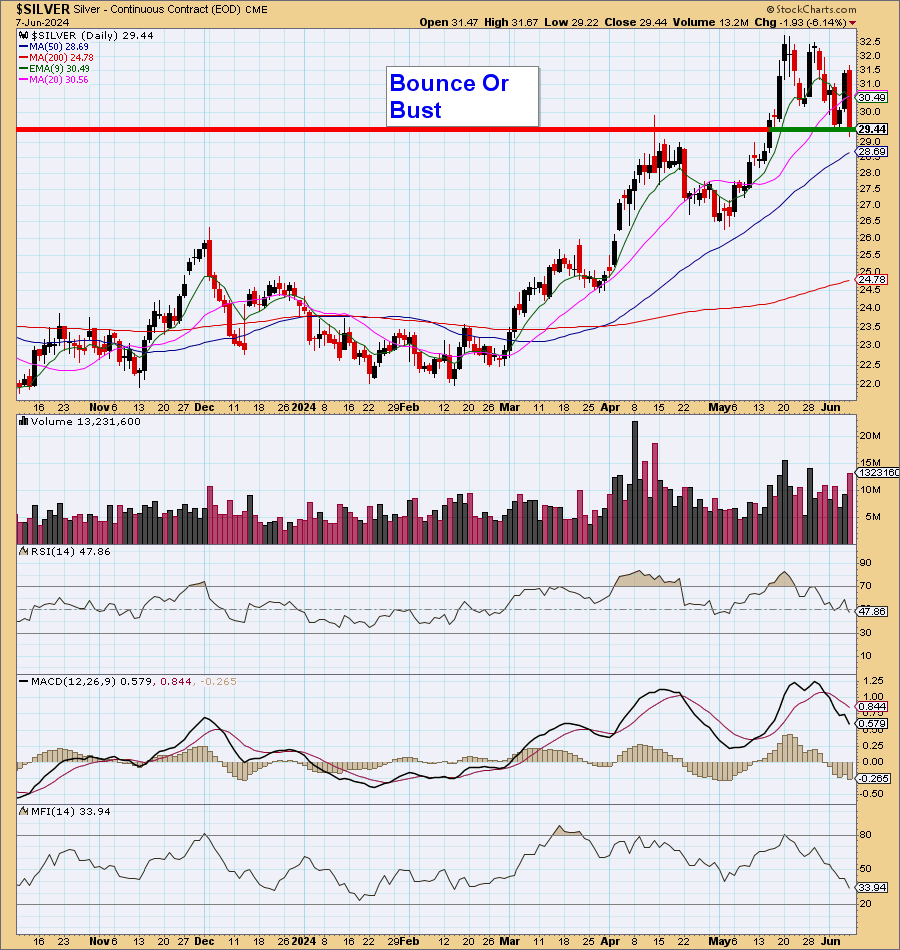
SILVER
The Silver chart shows abig level at the $30 level, with prices needing to hold above this support to avoid a further decline. The RSI is neutral, suggesting indecision among traders, while the MACD shows a bearish crossover, indicating potential downside momentum. The MFI reflects decreasing buying pressure, highlighting the importance of the $30 support level for maintaining bullish sentiment.
Overall Market Breadth Rating: 6/10 (Moderately Bullish)
Market Thesis
Current Market Environment: The market shows strong bullish momentum with significant caution signals across various sectors. The SPY and QQQ are showing signs of potential consolidation or minor pullbacks. The USD is gaining strength, which typically inversely affects tech-heavy indices like QQQ. Bitcoin is displaying a strong bullish setup, while traditional safe-haven assets like gold and silver are showing signs of weakening.
Day Traders: For day traders, the focus should be on volatility and quick pivots, taking advantage of short-term price movements influenced by news, technical setups, and market sentiment but, don’t be married to it. Hit it and quit it.
Swing Traders: Swing traders should look to position themselves for potential pullbacks in major indices while capitalizing on bullish trends in select sectors like cryptocurrencies. We can look to get short QQQ driven names while looking at Bitcoin related stocks for more diversifcation.
SPY
Daily Chart Analysis:
Momentum: Strong bullish momentum but showing signs of a minor pullback.
MACD: Diminishing momentum.
MFI: Approaching overbought territory.
Thesis: The SPY is likely due for a pullback to around $530. Traders should prepare for consolidation or a minor pullback in the near term.
Trade Plan:
Day Traders:
Sell/Short: Look for shorting opportunities if SPY breaks below intraday support levels.
Buy: Consider buying on dips near the $530 support level with tight stops.
Swing Traders:
Short: Initiate short positions around current levels with a target of $530.
QQQ (Invesco QQQ Trust)
Daily Chart Analysis:
Momentum: Sustained upward momentum but hints of consolidation.
MACD: Positive but diverging.
MFI: In overbought territory.
Thesis: Similar to SPY, QQQ is due for a pullback. A potential correction period could be initiated by external catalysts like the Nvidia split.
Trade Plan:
Day Traders:
Sell/Short: Short opportunities if QQQ shows weakness or breaks below key support levels.
Buy: Intraday buying on significant dips, but with caution.
Swing Traders:
Short: Initiate short positions with a target of key support levels.
Gold (GOLD)
Daily Chart Analysis:
Support Level: Critical at $2300.
Momentum: Bearish crossover in MACD, reduced buying pressure.
Thesis: A move below $2300 would be bearish, suggesting a cautious approach.
Trade Plan:
Day Traders: Short opportunities if gold breaks below $2300.
Swing Traders: Avoid long positions until a clear support is reestablished.
Silver (SILVER)
Daily Chart Analysis:
Support Level: Critical at $30.
Momentum: Bearish crossover in MACD, decreasing buying pressure.
Thesis: Holding above $30 is crucial for maintaining bullish sentiment.
Trade Plan:
Day Traders: Look for shorting opportunities if silver breaks below $30.
Swing Traders: Avoid long positions until stability above $30 is confirmed.
Bottom Line
Market Outlook: The market breadth rating of 6/10 reflects moderate bullishness with significant caution due to overbought signals and potential for pullbacks in major indices. The strengthening USD and bullish Bitcoin setup offer diversified opportunities, while traditional assets like gold and silver warrant caution.
Lusso’s Focus Strategies:
Day Traders: Focus on volatility, shorting major indices on weakness, and capitalizing on Bitcoin's bullish momentum.
Swing Traders: Position for pullbacks in SPY and QQQ, hedge positions, and explore bullish setups in Bitcoin.
Disclaimer
Lusso's News Insider is intended for informational purposes only and does not constitute investment advice. The opinions expressed in this report are those of the author and do not necessarily reflect the views of Lusso's News Insider. Trading in financial markets involves significant risk and may not be suitable for all investors. Past performance is not indicative of future results. Before making any investment decisions, it is recommended to consult with a professional financial advisor to ensure that any strategies or investments are appropriate based on your individual circumstances and risk tolerance. Lusso's News Insider assumes no responsibility for any losses or damages resulting from the use of the information contained in this report. Use of this report constitutes acceptance of these terms and conditions.


