Key Stocks to Watch, Market Breadth Analysis, CHARTS INCLUDED
Read Now For Information On Stocks To Watch
HEY TRADERS AND VIP TRADERS!
In this report I go over:
A Watchlist, featuring stocks on my radar with charts included.
Market breadth analysis
Market breadth rating 1 out of 10? What is the rating for the week? Find out in the report!
Market Breadth Analysis
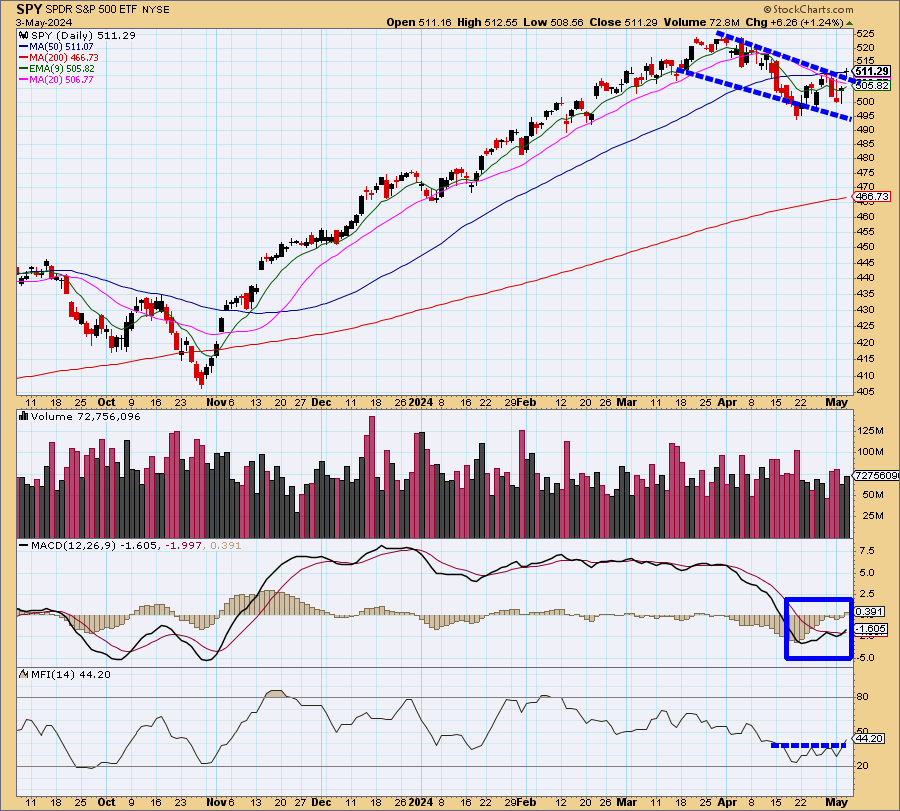
S&P 500 SPY
The SPY shows a bullish continuation through a clear bull flag pattern, with a recent breakout showing momentum to the upside.
The MACD supports this bullish trend, showing a bullish convergence. The sustained high volume during the breakout and the positioning of the 50-day above the 200-day moving average further confirm the strong bullish sentiment in the market.
Overall I would say that momentum is to the upside with the 20sma and 9ema now below price which confirms price strength to the upside.
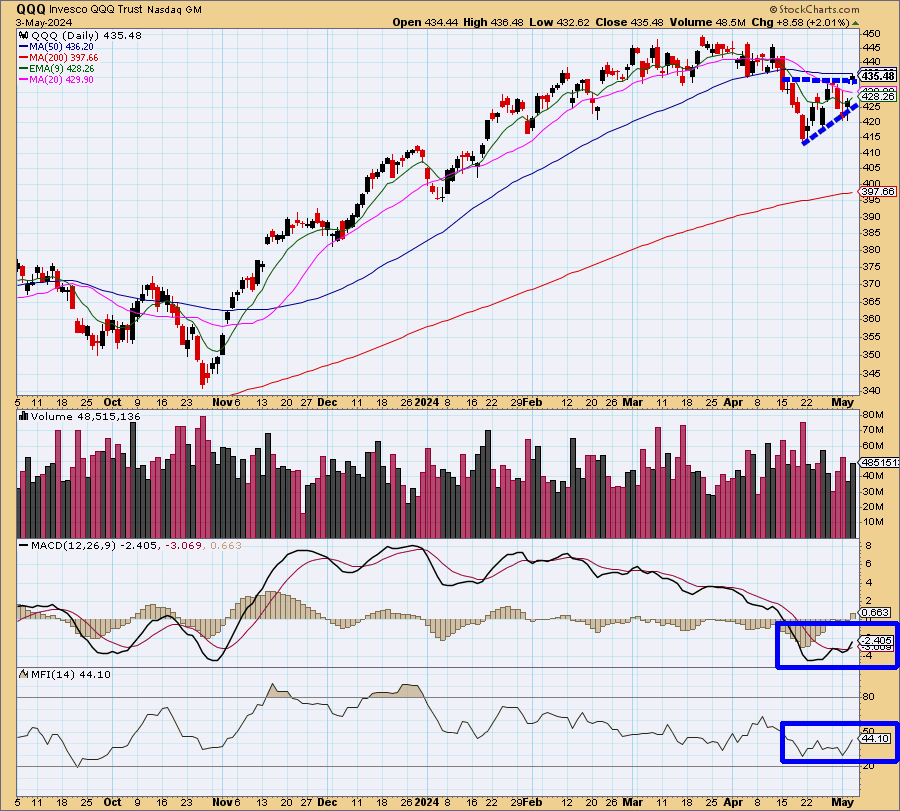
QQQ
The QQQ shows the 50-day simple moving average (SMA) acting as a key resistance level, with the price currently testing this line. The failure to break above the 50-day could cause some selling pressure so we want to make sure that the QQQ does pivot over the $511 mark strongly.
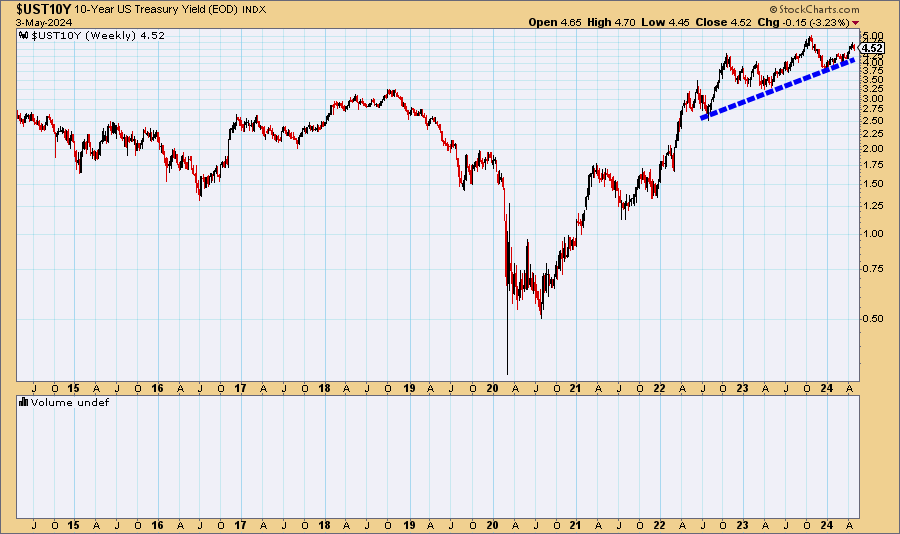
10 Year Treasury Yield
The chart of the U.S. 10-Year Treasury Yield shows a strong uptrend.
This rising trendline, underscores strengthening expectations for interest rates and potentially reflects broader inflationary pressures. If this uptrend in yields continues, especially with a significant uptick this week, it could induce fear in equity markets.
Higher long-term yields often signal rising borrowing costs and can lead to shifts in investor sentiment, potentially pulling funds away from stocks into bonds. This dynamic is crucial for us to monitor, as it influences portfolio adjustments and risk assessments across various asset classes.
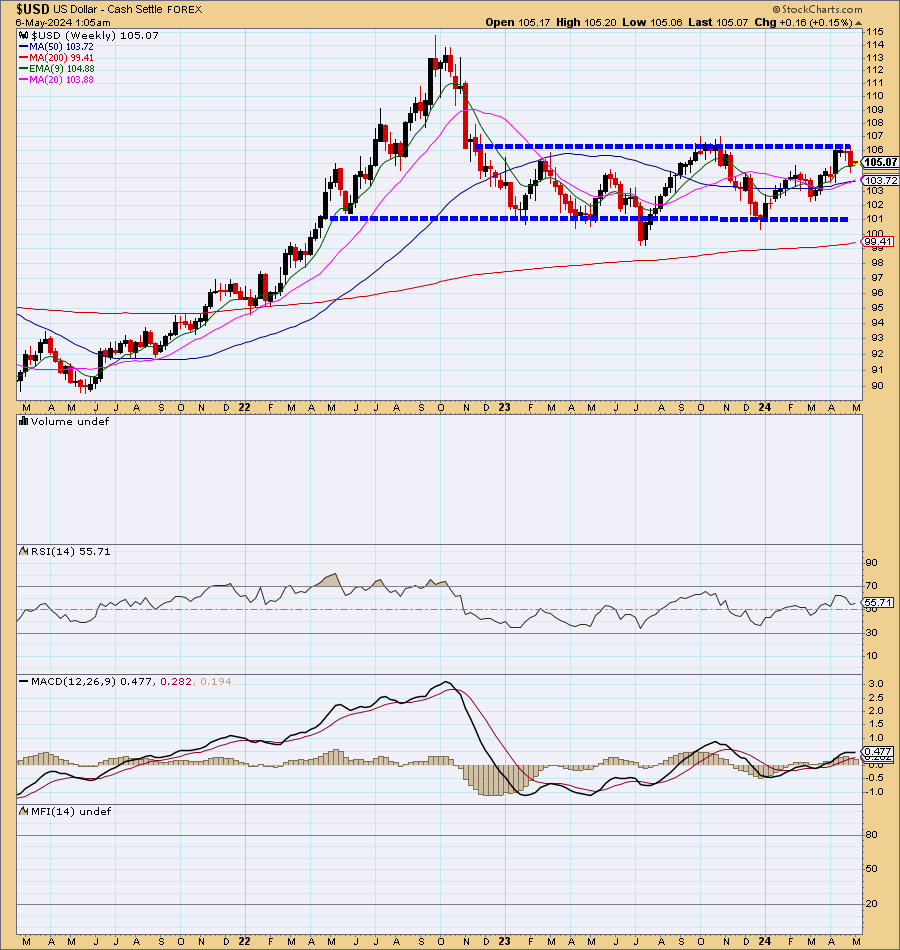
USD
The U.S. Dollar Index (DXY) chart displays a significant resistance zone around the 105 level, which has previously acted as both support and resistance, making it a critical point for us to watch.
Currently, the dollar is trading near this key level.
A drop below 105 could confirm weakness.
Below $105 is bullish for stocks!!
Bitcoin
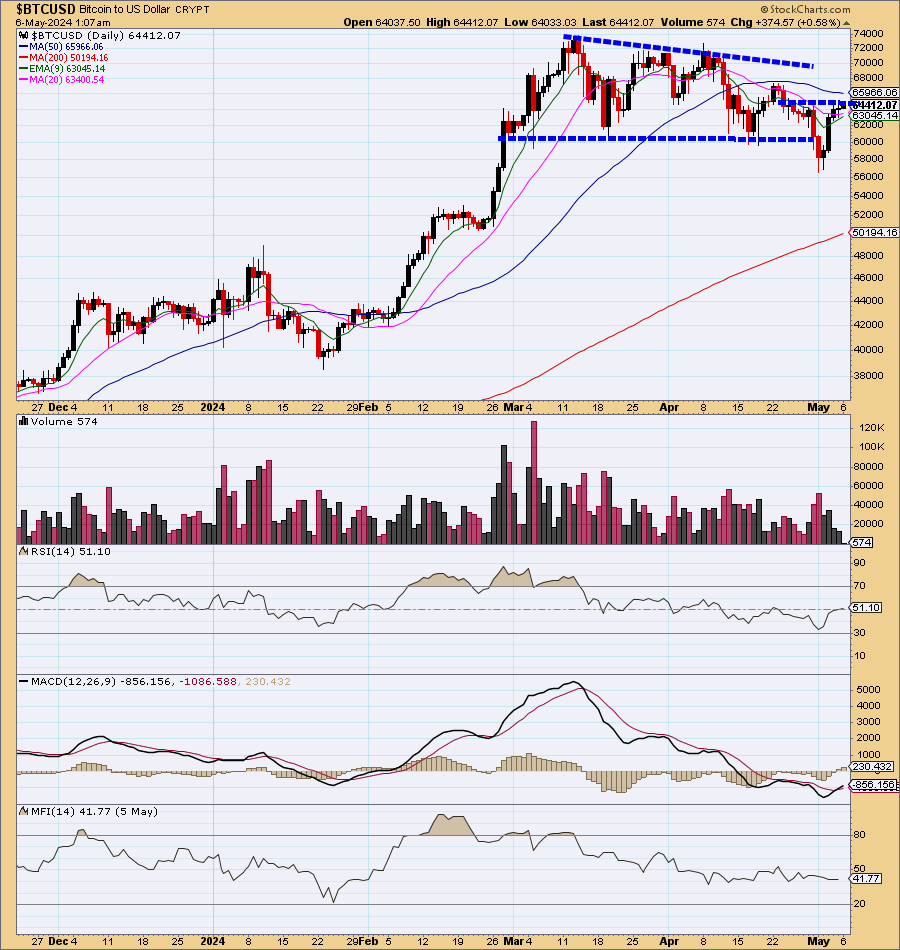
Bitcoin is trading in an ascending triangle pattern which is bullish.
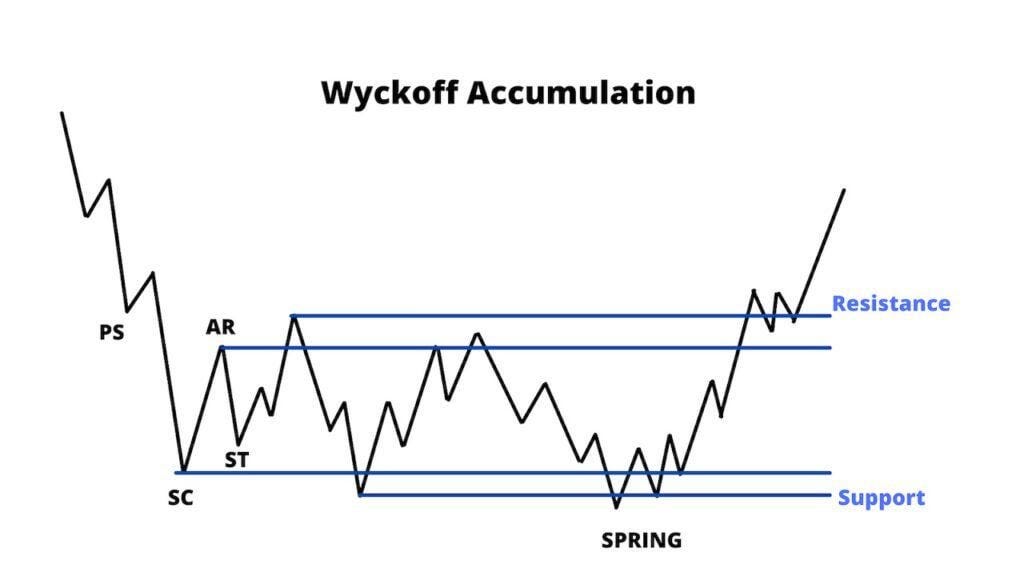
It recently had a wykcoff spring pattern.
Over $64,500 would confirm my bullish thesis here.
All Bitcoin related stocks are on watch!
MARA
COIN
RIOT
BITF
HOOD
Market Breadth Summary
The upcoming week in the markets presents a blend of bullish and cautious signals across different asset classes. The SPY is notably strong, displaying a clear bull flag breakout with supportive volume and bullish MACD signals, indicating robust upward momentum. This is backed by the QQQ, which is at a pivotal point with the 50-day SMA acting as resistance; its ability to surpass this level could significantly sway the tech-heavy index's direction.
Concurrently, the 10-Year Treasury Yield's uptrend signals potential inflationary pressures and rising interest rates, which traditionally instill caution in equity markets, as higher yields can divert investment away from stocks towards bonds. The USD's position near a critical resistance at 105 is also crucial, where a drop below this level could weaken the dollar, generally favoring stock market gains.
Also, Bitcoin’s bullish patterns and potential breakout above significant levels suggest an increased appetite for risk in cryptocurrencies, possibly influencing related equities positively.
Overall Market Outlook Rating: 6/10 - The mix of strong bullish signals in certain sectors against potential caution due to rising bond yields and critical resistance levels in the USD creates a nuanced market environment.
We need should remain cautious, ready to adjust to shifts in these key indicators which could drive market sentiment in either direction over the next week.
This rating reflects an overall cautiously optimistic view, recognizing the potential for both continued gains in certain areas and volatility induced by macroeconomic factors.
Stocks On Our Radar
SNOW
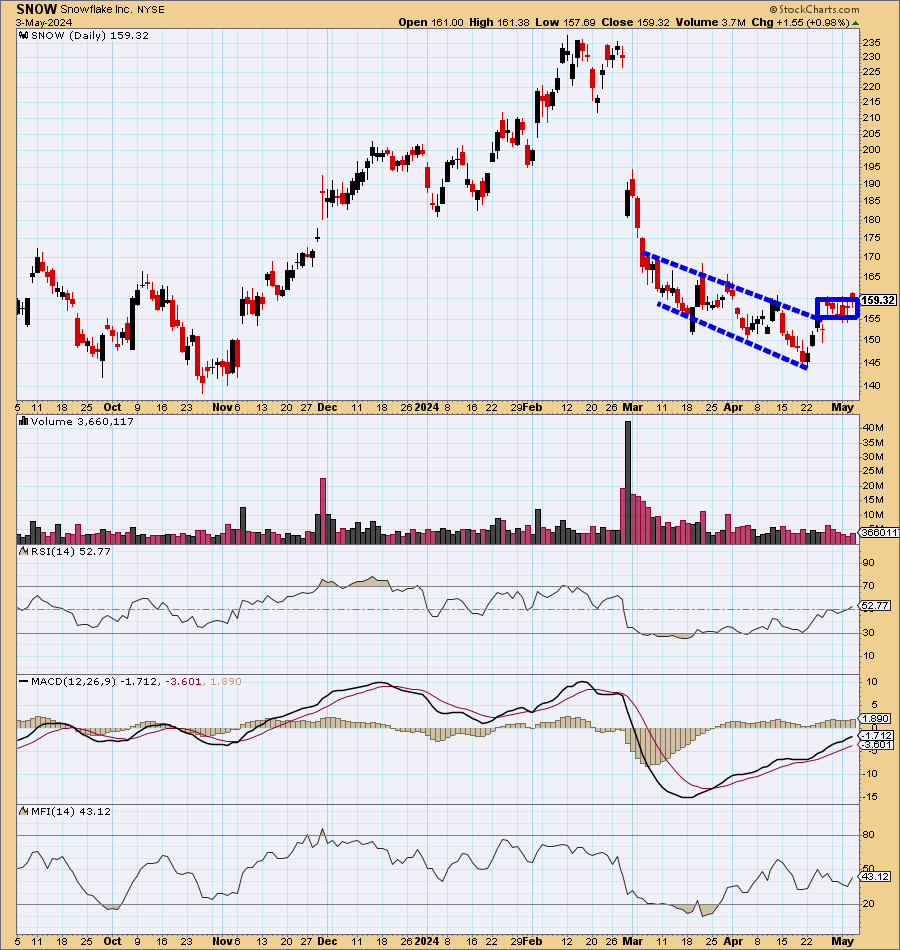
I want to keep SNOW on watch for a move above $160. It recently broke out of a falling wedge and has been trading between $155 and $160 a very tight range. A move above $160 could signal a next leg higher.
Right now in the pre market session it is currently trading above these levels.
Keep in mind they report earnings May 22nd.
DNA
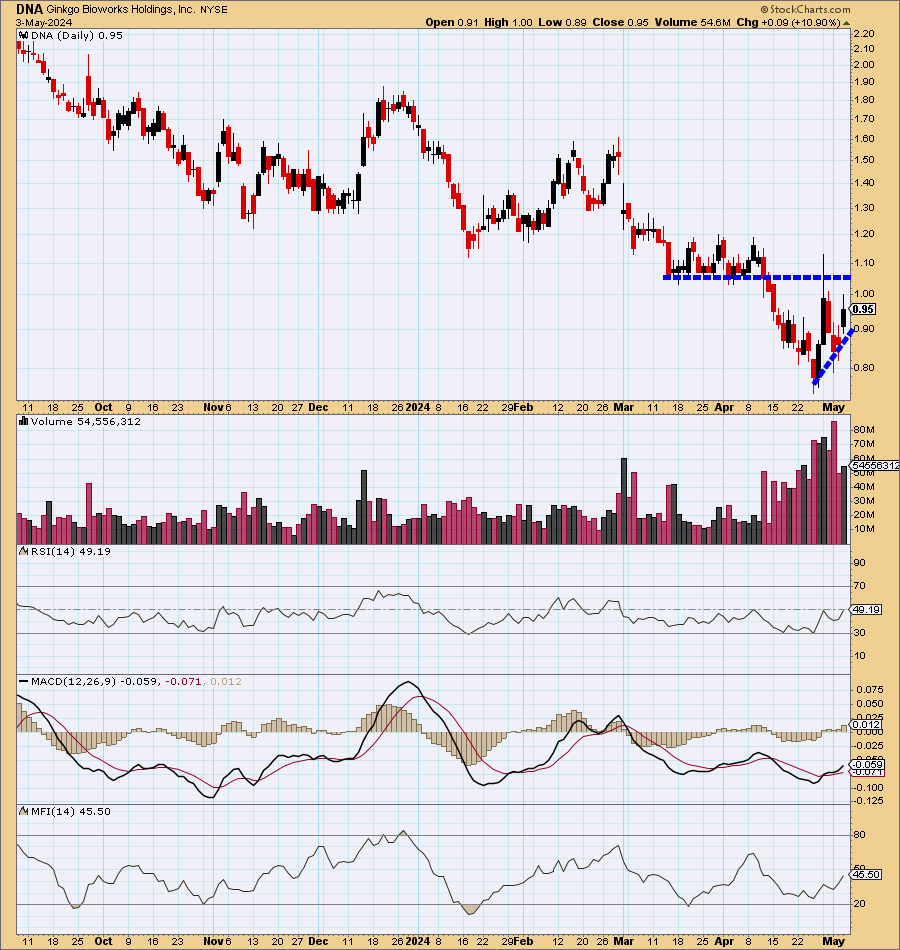
DNA reports May 9th and they usually drop on earnings as they have been diluting but, this is a company that has people like Cathie Wood and Bill Gates involved. I am long as of last week and am up 7% on the trade so I may look to trim ahead of earnings but, it definitely is on watch for a short squeeze pop over $1 due to the fact that it has a large short interest a catalyst and trades over 100million shares a day usually which attracts the big whales to come in as they can get in and out quickly.
The $1.20 area is of interest but again, they need to stop diluting.
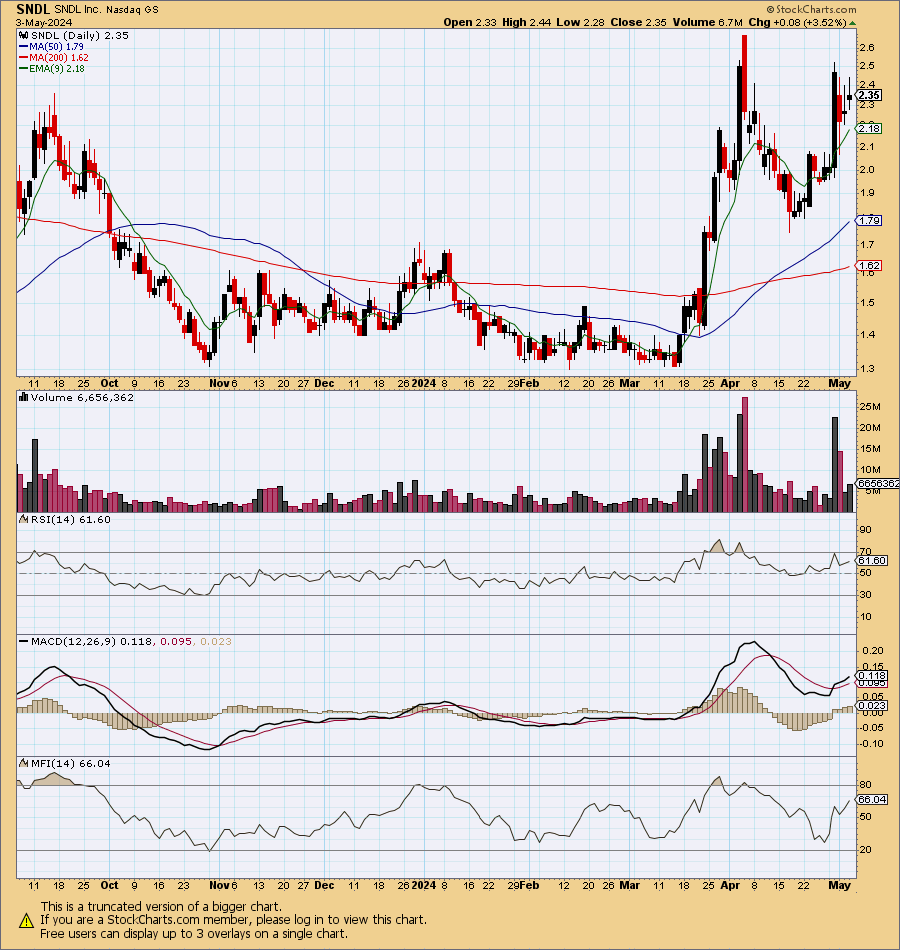
SNDL
Weed stocks have been on a huge run with CGC, ACB, TLRY and SNDL moving.
I am watching SNDL for a short due to the fact that the stocks volume dramatically declined on Thursday and Friday last week.
Any weakness in the cannabis space and SNDL could see under $2.
I am just watching for now, not trading it as momentum is still to the upside but, I do see areas of exhaustion.
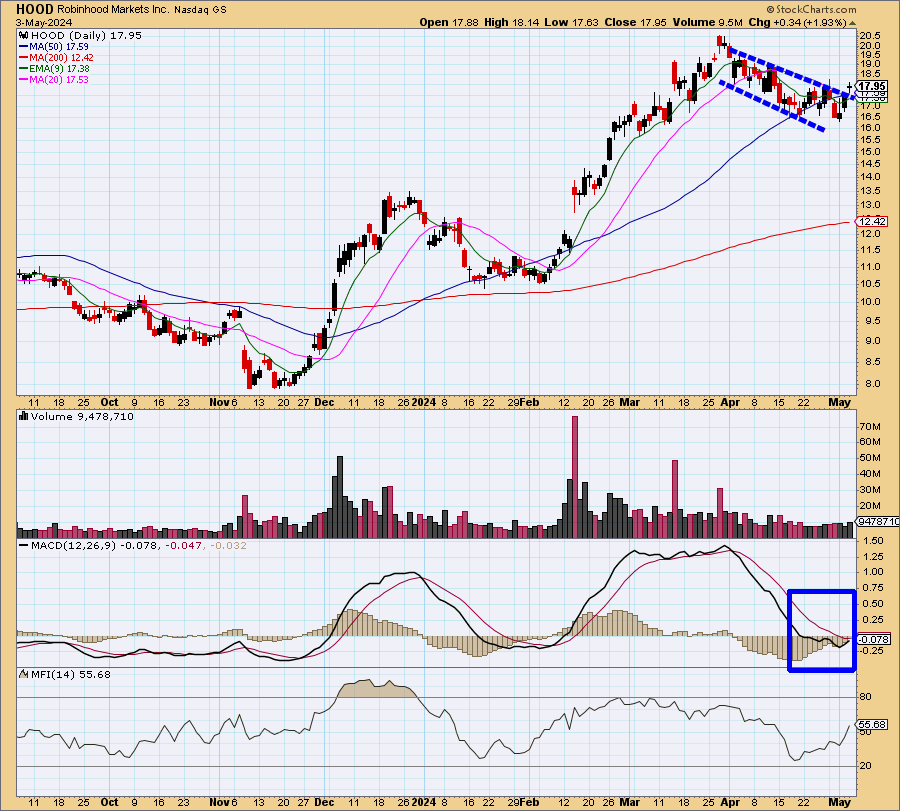
HOOD
HOOD appears to be breaking out of a flag pattern.
Remember in the market breadth segment we spoke about Bitcoin seeing potential strength?
With the MACD bullishly converging and price breaking out above the flag pattern it is of interest here for a momentum trade!
Over $18 is the area of focus.
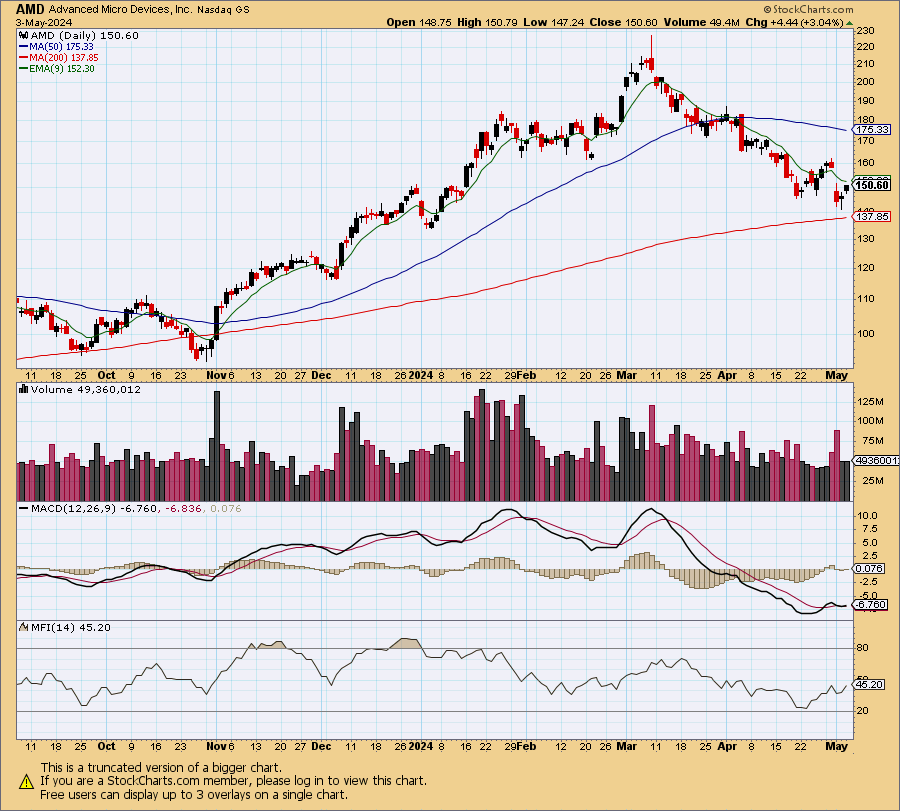
AMD
AMD is currently a work in progress due to the 20sma and 50sma being dramatically above price action.
With this being said, if you are patient then you could put this one on your radar because this morning AMD is trading above the 9ema (green line). As you can see it hasn’t traded above the 9ema much since its sell off from 225 to 150.
If it can hold above $152 then we could start to see demand come into it.
Over $157 is where demand really could come into this stock!
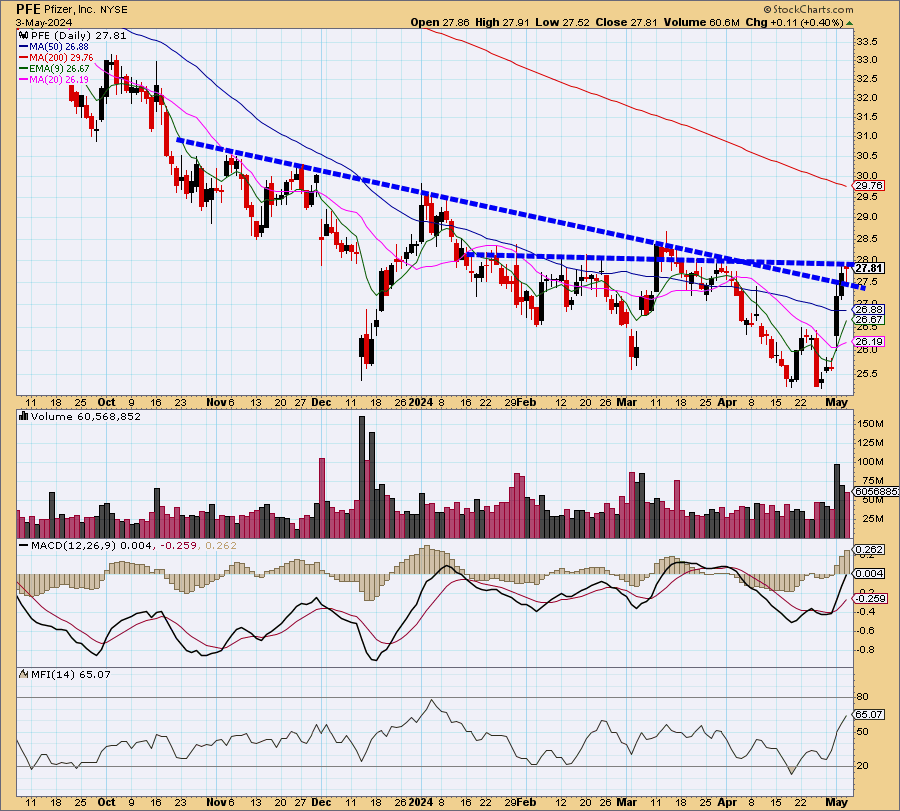
PFE
PFE had strong volume last week and is nearing a key pivotal mark at $28.
DIS
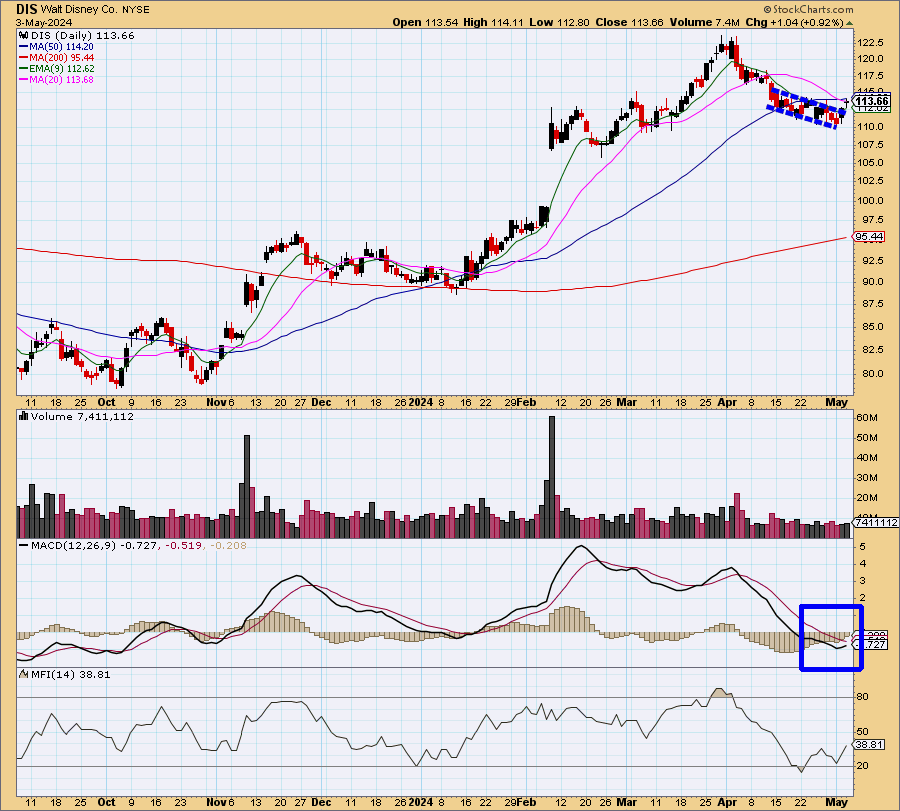
DIS is attempting to breakout of a falling wedge with a MACD bullishly curling.
Over $114.20 is the area I would consider taking a long position as that would signal a move above the 50sma.
DKNG
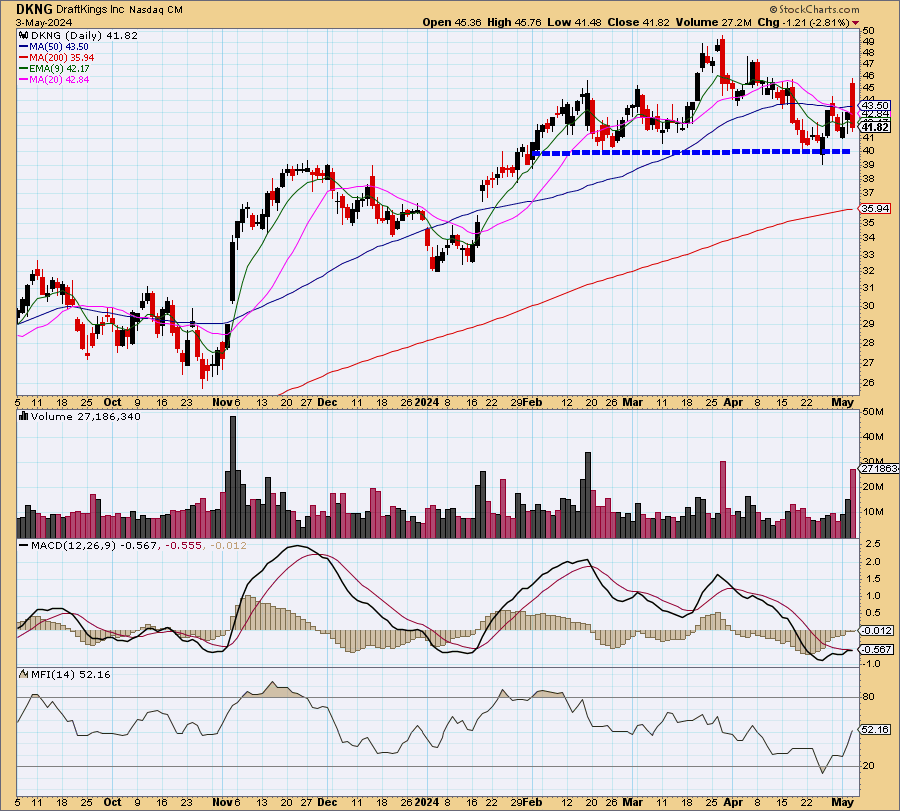
DKNG is on the watchlist for a seasonal short. I say the word seasonal short because NFL season is over and the NBA Season is nearly over leaving it a slower season for sports betting.
I will have to finish the watchlist during the day as the market is nearly open and I want to get this report out before the open.
If you have any question please free to ask.
Trader Watchlist
1. Snowflake (SNOW)
Key Level: Watch for a move above $160.
Trend: Recently broke out of a falling wedge, trading in a tight range between $155 and $160.
Note: Currently trading above these levels in pre-market. Earnings report due on May 22nd.
2. Ginkgo Bioworks (DNA)
Key Level: Short squeeze potential if moves over $1; watch $1.20 for significant resistance.
Trend: Long position recently taken; up 7%. High trading volume and significant short interest.
Note: Earnings on May 9th; history of price drops due to dilution. Influential investors like Cathie Wood and Bill Gates involved.
3. Sundial Growers (SNDL)
Key Level: Watching for any drop under $2.
Trend: Decrease in volume and potential exhaustion despite recent run-ups alongside other cannabis stocks like CGC, ACB, TLRY.
Note: Monitoring for now; momentum still bullish but potential for short on signs of sector weakness.
4. Robinhood (HOOD)
Key Level: Focus on moves over $18.
Trend: Breaking out of a flag pattern, potentially driven by broader crypto market strength.
Note: MACD showing bullish convergence.
5. Advanced Micro Devices (AMD)
Key Level: Watch for hold above $152 and a significant move if it surpasses $157.
Trend: Struggling under the weight of the 20sma and 50sma, but showing signs of recovery as it trades above the 9ema.
Note: Significant recovery from recent sell-off, showing early signs of demand.
6. Pfizer (PFE)
Key Level: Nearing a pivotal mark at $28.
Trend: Strong volume last week, indicating potential upward movement.
7. Disney (DIS)
Key Level: Watch for a breakout over $114.20.
Trend: Attempting to break out of a falling wedge; MACD curling bullishly.
Note: Move above $114.20 would signal a break above the 50sma, indicating bullish potential.
8. DraftKings (DKNG)
Strategy: Seasonal short consideration.
Trend: Post-season slowdown in sports betting expected as NFL and NBA seasons wind down.
Note: Keep an eye on market sentiment shifts with the end of major sports seasons.
DISCLAIMER: Lusso’s News LLC offers no guarantees and provides forward-looking statements with the sole purpose of offering personal enjoyment and entertainment to its readers and viewers. If you choose to purchase any securities mentioned in our articles, posts, newsletters, or comments, you agree to hold Lussosnews.Com, Powerhouse.substack.com, Lusso’s News, LLC and all of the authors free and harmless from any liability. Investing in financial markets is risky, and you may lose your entire investment at any time. Lusso’s News, LLC never guarantees or offers recommendations, and the company will not be responsible for any loss or damage that occurs.
We want to emphasize that we have a strict refund policy, and we do not offer personalized investment advice. Our products and services are for educational and informational purposes only and should not be construed as a securities-related offer or solicitation. We highly recommend that you consult a licensed or registered professional before making any investment decision. Please be aware that Lusso’s News, LLC and its owners or employees are not registered as a securities broker-dealer, broker, investment advisor (IA), or IA representative with any regulatory authority. We do not give out advice, and our publication is solely for information and education.
We want to make it clear that our information is subject to our terms and conditions and disclaimer. Our report is for informational purposes only and is not a buy or sell investment or trade advice. No specific outcome or profit is guaranteed, and the full risk of losing money on a trade applies. Please understand that our writers and traders are not licensed or financial advisors.


