July 16th: One Powerhouse Featured Stock + 5 Stock Charts To Watch
Lusso's Powerhouse Report: July 16th Edition
Disclaimer: This article is intended for information purposes only. Any actions taken while/after reading this article is your choice and is 100% your responsibility. We are not recommending stocks but, publishing information only. Best of luck to everyone.
Also, make sure to subscribe to our Substack so you don’t miss a Powerhouse Report.
Inflation is rising, yes.
10 Year Treasury Yields are trading lower, yes.
The US Dollar is trading higher, yes.
What does this mean?
The bond market is saying the opposite than what the news headlines are saying.
The news is saying inflation but, Treasury yields are selling and the Dollar is rising.
So that brings us to a question, Are We Headed Into A Deflation Period?
Regardless of deflation or inflation there is one stock that continues to perform in great economic conditions and bad economic conditions.
Costco Wholesale Corp [NASDAQ:COST]
Costco is the first stock featured in this report. As it may look over extended in the near term with a RSI above 70 it has made this report because of the potential demand that can come inside the stores due to the Enhanced Child Tax Credit.
Child Tax Credit
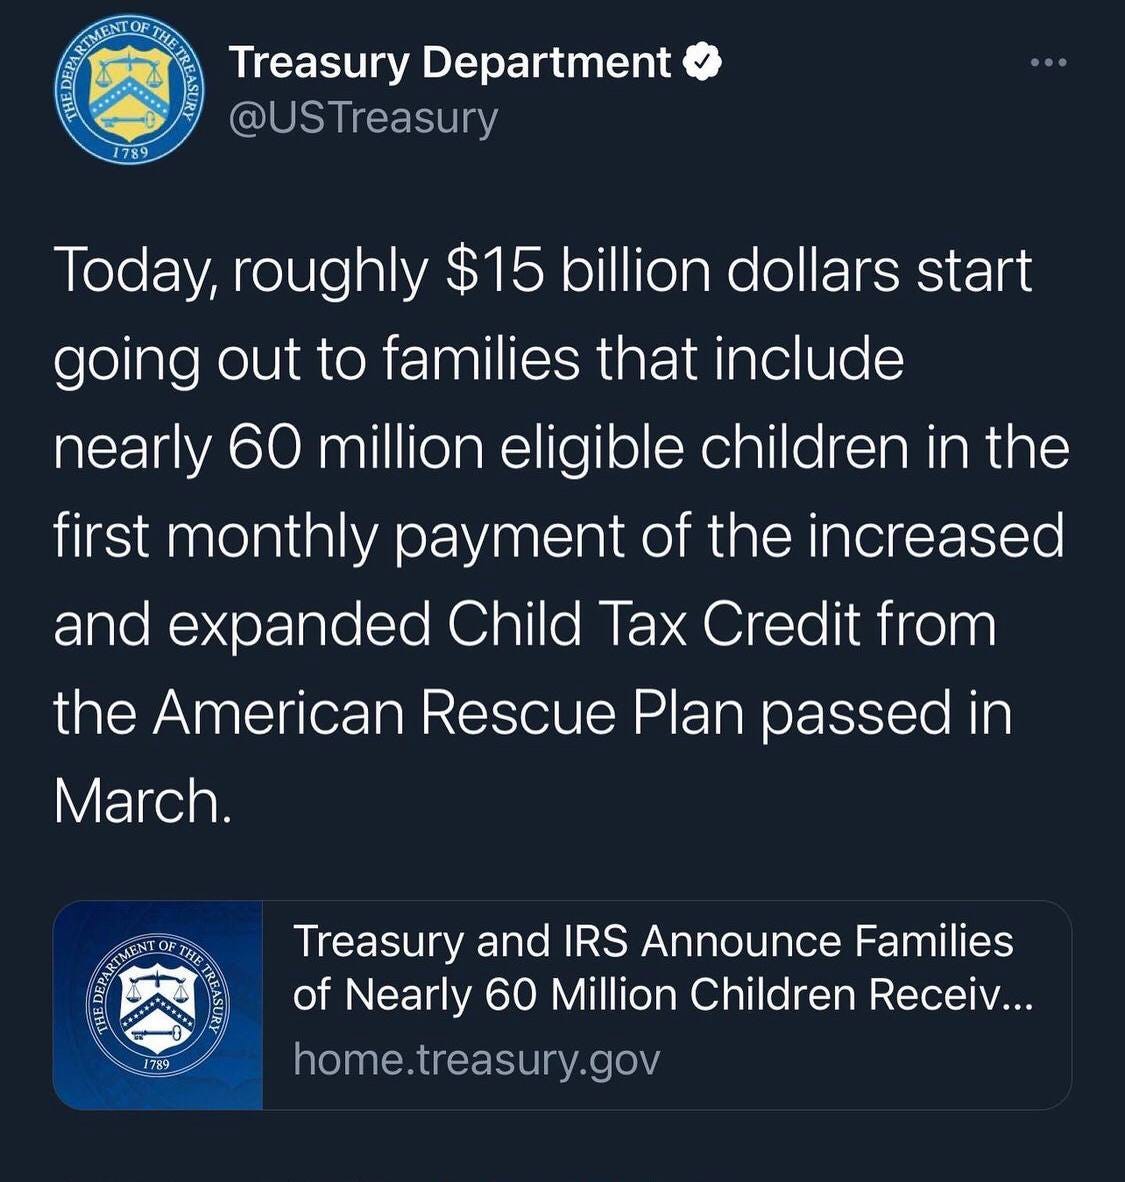
On July 15th the United States Enhanced Child Tax Credit started to hit families direct deposits of around 35 million families. In fact according to As.com the IRS did confirm that yesterday around 35.2 Million families have been sent a direct payment.
In the past only people who earned enough money to owe income taxes would qualify for this credit but, now a average of $423 per month will be hitting families direct deposit account.
“The IRS and Treasury said it sent payments for almost 60 million children on Thursday, totaling $15 billion. Almost 9 of 10 payments were sent via direct deposit, the agencies said.”- CBS News
How does this potentially benefit Costco?
Costco is a family experience. Families go together to Costco and shop and with more money coming into families pockets, more money could be spent at Costco.
Here is a quote from CNBC article back in 2017, “I’ve spoken to a few consumers that have started their relationship with Costco not so long ago and several of them recall the Costco experience with their families — shopping trips, eating in the food court, items at home — and so for them to now go back and have their own membership also almost becomes a rite of passage,” says Hong
Increased Memberships
Costco requires a membership to shop at their store. In fact, the majority of their items are sold in bulk so products are more expensive because you are buying more at once. Now that families are receiving on average $423 per month too as much as $1,000’s per month extra, it will be interesting to see if memberships do increase as families look to change their shopping habits.
With gas prices rising across the nation as inflation does rise, being a Costco member allows you to fill up your cars gas tank at Costco’s gas stations which are dramatically lower priced than the average gas station. This alone could cause membership demand.
To Summarize this section:
Things that could bring demand to Costco:
Raised gas prices=more members to take advantage of Costco’s lowered gas priced
Will more families become members to Costco with more income per family due to the Child tax credit?
Will consumer shopping habits change and households start spending more money on groceries per household?
Will deflation impact Costco?
Costco has been called a “Recession Proof Stock” by many publications in the past. The ability for this company to thrive and stay alive during a contracted economy has gained the attention of many.
Costco’s customer base has a average household income of over a $100,000/year. With their customers in the middle class with steady income, they are not impacted as much by a contracted economy. This has allowed Costco to have stayed alive during past recessions.
INFLATION is GOOD
The news and headlines think of inflation as a bad thing for stocks. It may be for lower income per household stores but Costco has a customer base that are usually in strong financial standing.
With prices inflating Costco has already warned customers of possible price hikes for key goods.
Price hike are only bad if demand decreases. If demand increases or stays the same, price hikes will mean more money and revenue for Costco.
Now, as Costco is seeing their suppliers raise prices by as much as “double for containers and shipping” it could have a impact on margins in a negative manner.
The Trader
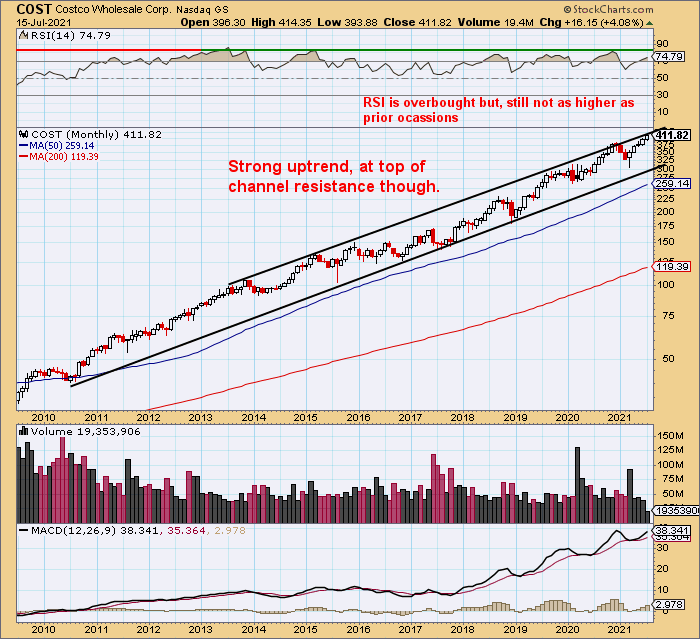
Costco's monthly chart shows a few things worth mentioning:
It is in a very strong uptrend since 2010
It is currently trading near upper channel resistance
The RSI is overbought above 70 but, it has been higher multiple times in the past
Stock Chart is courtesy of StockCharts.com
Looking at the monthly chart you are probably wondering, why this is on the powerhouse report.
This is not featured as a Momentum stock but, being featured as a potential strong stock in a longer term portfolio.
Now for the momentum short term trader…
The Daily Chart
For short term traders…
Costco had a very bullish breakout over $388 which resulted in a additional breakout over $400. Now, it is trading in a range around $404 and $415.
The area to watch in my opinion is going to be around the $415 area. If it does breakout above the $415 area this stock can potentially continue to drift to the upside on momentum. As it continues to move higher with little consolidation, the risk is higher for a volatile pullback or shakeout so stops should be raised as price increases in my opinion.
Now for dip buyers..
Costco has yet to pullback and test $400 and confirm it as support. Often when a stock breakouts it will pullback at some point to a key level and test it and if it is strong will hold as new support. If it does indeed pullback, then around $400 or around $388 could be areas of support.
Warning: If Costco does fall below $388 which was the prior breakout level then it could attract supply and possibly cause more weakness so in my opinion, be careful.
5 Charts To Watch
All charts are courtesy of Stockcharts.com
AbbVie Inc [NYSE: ABBV]
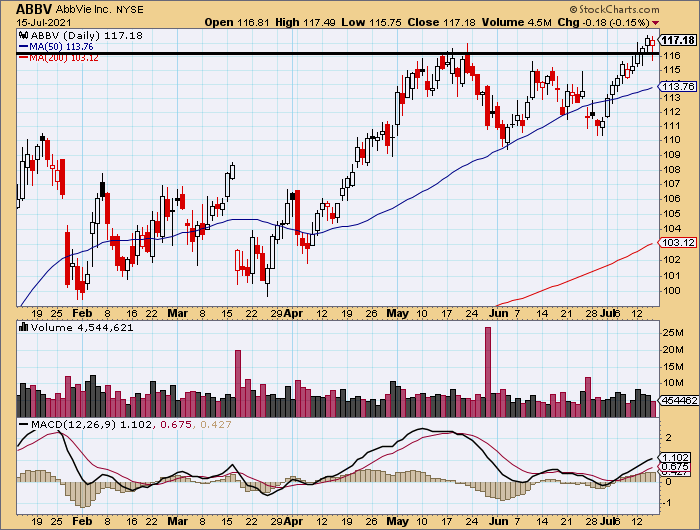
ABBV recently broke out above prior resistance from back in May. On Wednesday and Thursday it pulled back testing the prior resistance area around $116. It did close above $116 which shows that it held this area as support.
ABBV is also showing increase volume in July associated with the stock going up. If this stock continues to trade above $116 then it is something to watch for potential momentum.
BJ’s Wholesale Club [NYSE:BJ]
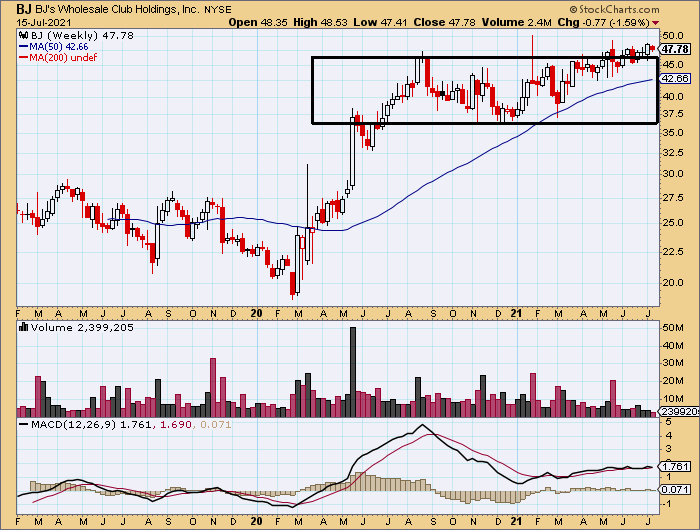
BJ’s has been consolidating for over a year now. This company is similar in a way to Costco and one is to wonder if the enhanced child tax credit will bring demand to BJ.
Anyways, the chart is trading above prior resistance and is starting to potentially make a move towards $50.
The area where I personally would want to see it hold is $45 as support but, it would be better if it didn’t pullback.
As volume is low it shows that traders and investors and not participating at a high level, there is not a high demand for this stock.
Now, in my opinion volume is something to watch here. If volume does move in, it could show up on more traders scanners and then people will see what we see, “consolidation breakout with potential of a breakout over $50”.
Boeing Co [NYSE:BA]
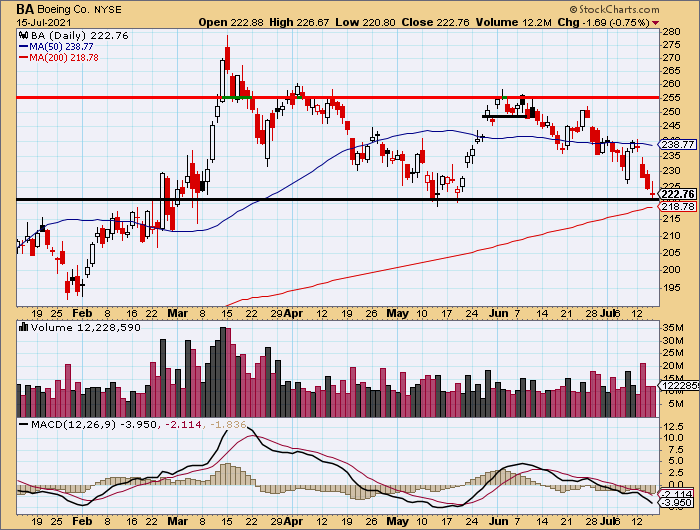
BA has been trading in a range from around $255 to around $220 since April to current.
After it tested the top of this range in early June, it rejected it once again as resistance.
It is something to watch to see if:
it holds around $220 as support again
it holds the 200 day moving average around $218.78
Autodesk [NASDAQ:ADSK]
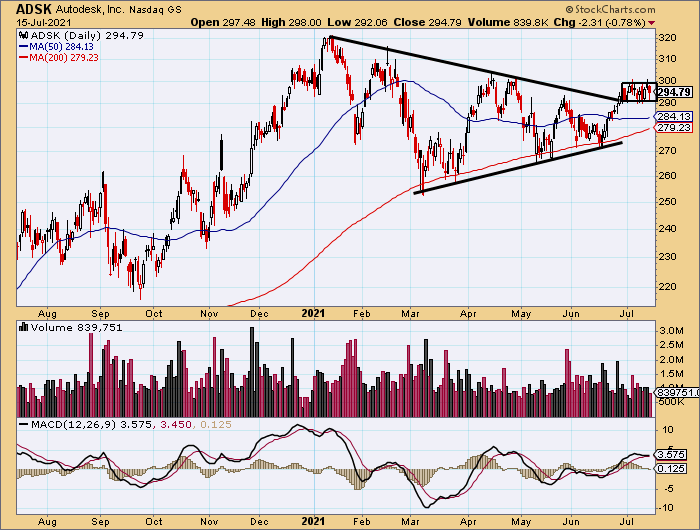
ADSK recently broke out of a 6 month symmetrical triangle chart pattern.
Since the breakout it has been consolidating between $290 and $300.
Over $300 could possibly be a breakout level and therefore is something to watch.
The 50 day moving average is starting to curl to the upside with the 200 day moving average trending up as well. This shows momentum is possibly shifting to the upside after trading in a downtrend since 2021 began.
Overstock.com [NASDAQ:OSTK]
OSTK recently broke out at the end of May but has failed to gain momentum to make a move above $100.
As it has now been trading sideways between $85 and around $97 it had a strong close yesterday in my opinion which is worth mentioning.
As it had a violent sell of Wednesday on high volume it then sold below support Thursday and below the 50 day moving average but ended the day closing above support and above the 50 day moving average. This could be seen as a lack of supply under these key areas of support.
How come traders didn’t sell under this area of support? If people aren’t selling then it is for one reason…They think the stock is going higher.
Wrapping Things Up
Thank you and Congratulations on being a subscriber to Lusso’s Powerhouse Report.
Make sure to Subscribe, Share and Leave a comment.
You can follow the author on twitter: @ChartBreakouts
You can email us at: info@LussosNews.com
Or message us on WhatsApp : +1 929 251 5090
Sources used in this newsletter
https://www.cbsnews.com/news/child-tax-credit-2021-payments-july-15-2021-07-15/
https://www.cnbc.com/2019/05/22/hooked-how-costco-turns-customers-into-fanatics.html
https://en.as.com/en/2021/07/16/latest_news/1626423596_040182.html





This is great!