Is This Stock Going To $0? S&P 500 Thoughts, The Hottest Industry On Wall Street...
A breakdown of the hottest industry on Wall Street
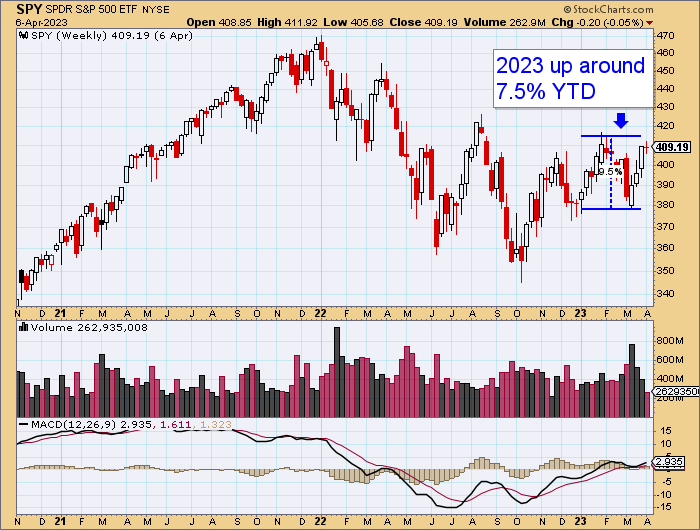
At the beginning of 2023, we made a compelling thesis that there would be an increase in money inflows into the financial markets, leading to an upward trajectory. Our prediction has come to life, with the S&P 500 up around 7.5% year-to-date. When analyzing the weekly chart of the SPY, we can identify some noteworthy thesis points.
To begin, the S&P 500 tested the $380 level at the start of March. A move below this critical level could have resulted in the S&P 500 being negative on the year. However, the bears failed to break this level, and the bulls capitalized on this missed opportunity, driving prices upward.
Despite being a significant development, this move at the start of March went unnoticed due to traders being preoccupied with headlines rather than price action.
The large sell-off at the start of March caused short sellers to become more aggressive and FOMO traders to buy puts and short on the equity side. However, their prediction of a meltdown proved incorrect, resulting in a melt-up.
As a result, short sellers are now trapped, with the significant level being around the $415 mark on the SPY. If the SPY surpasses this level, it could force short sellers to cover their positions, and a chart breakout over $415 may attract more demand, with buyers stepping in due to added confirmation and momentum.
Daily Chart
On the daily chart of the SPY, the 9ema is now riding price action, indicating a healthy trend. However, we need to see the 20sma cross over the 50sma, and the 20sma to catch up to the 9ema.
In the meantime, it is important to be cautious of chop and to trade up or down instead of sideways. After a significant run-up from $380, the SPY has yet to consolidate.


