ANNOUNCEMENT TO PAID READERS:
All of our paid readers have this entire week free. Meaning, if you have a monthly membership, this week is free and if you have a annual membership this week is free.
No new member can subscribe until 12/06.
I paused billing until 12/6 because the market has been trading sideways and there has been low conviction and as you know, we only focus on HIGH CONVICTION on our report, so I do not want to charge everyone during a low conviction period.
We want to protect our brand and we would rather give you guys/gals time for free instead of putting out low quality, low conviction reports.
We are a report that is focused on QUALITY only and not quantity.
Some reports feel the need to put something out just for the sake of putting something out but, in reality is does more harm than good because it is unproductive content.
In this business, if I give you unproductive content, it will lose readers interest and hurt our brand. We want our readers to get excited when our reports are sent so that you know you're getting good quality every time and not just “words to make it seem like you're getting something”
With this being said, we are sharing a FREE PICK we are watching as we like this chart if it does breakout.
Enjoy👇
When it comes to stock charts, I always think horizontal.
Over my years in the game, I found that horizontal breakouts are more reliable than diagonal pattern breakouts. Of course, both are prone to failures but, they still are something I watch.
I am not sure if you have been paying attention to the midterm elections but, they recently have happened in the United States and these impacts certain industries.
This Chartist HAs His Eye On this Industry…
It is going to be the Cannabis industry group.
Looking at the picture from Time.com we can see that more and more states are legalizing cannabis for recreational use and these Midterms 2 states were added to the list.
Source: Where Marijuana Failed in the 2022 Midterm Elections | Time
The Stock To Watch…
The stock worth keeping a eye on in my opinion is going to be Tilray Inc [NASDAQ: TLRY 0.00%↑ ].
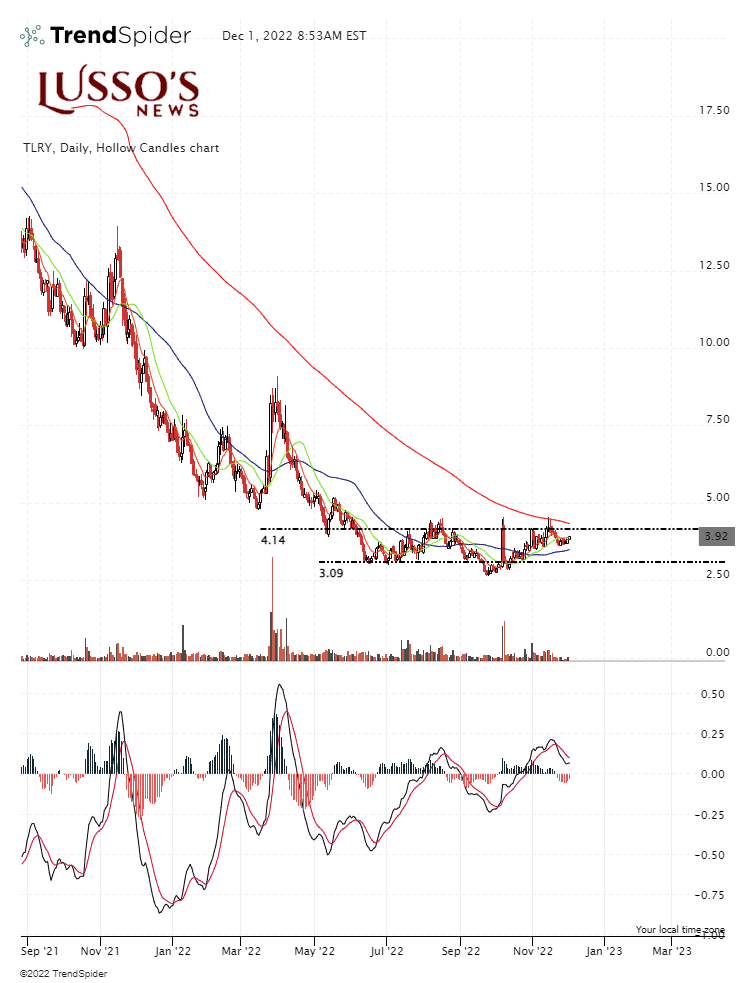
This stock has been trading in a solid sideways channel since June and is now nearing the top of the channel resistance point which is around $4.12.
A few factors of interest
When trading I always want to STACK probabilities in MY FAVOR. I want as much probabilities working for me to give me the best chance at success!
Here is what I want to see on $TLRY:
1) S&P 500 ABOVE 200 day moving average
This will give TLRY the best chance at having strength as a strong market is good for stocks!
2) TLRY above key resistance area around $4.12 and above the 200 day simple moving average on the daily chart.
Having price above the 200SMA and resistance on the chart shows me the line of least resistance is now to the upside and I always want to trade on the line of least resistance.
3) Lastly, I want to see HIGH VOLUME on the breakout, if it does breakout. This will show me there are a lot of people interesting in participating in this price going higher!
High volume gives confirmation to a breakout. A breakout on low volume is a low conviction breakout.
The Chart
The Bottom Line
The bottom line is this stock has a nice base but, it is in a downtrend. Waiting for a breakout is a MUST in my opinion and not trying to get in early. As trader we always want to react and not ‘forecast’.
This industry could be a industry that expands massively in the next decade but, there is not telling what company will be of dominance though.
As for now, we do like to trade channel breakouts and this channel is something we are watch on TLRY.
US DOLLAR IS AT A MASSIVE TECHNICAL LEVEL
The US Dollar has been one of the strongest assets one can own for the last multiple months.
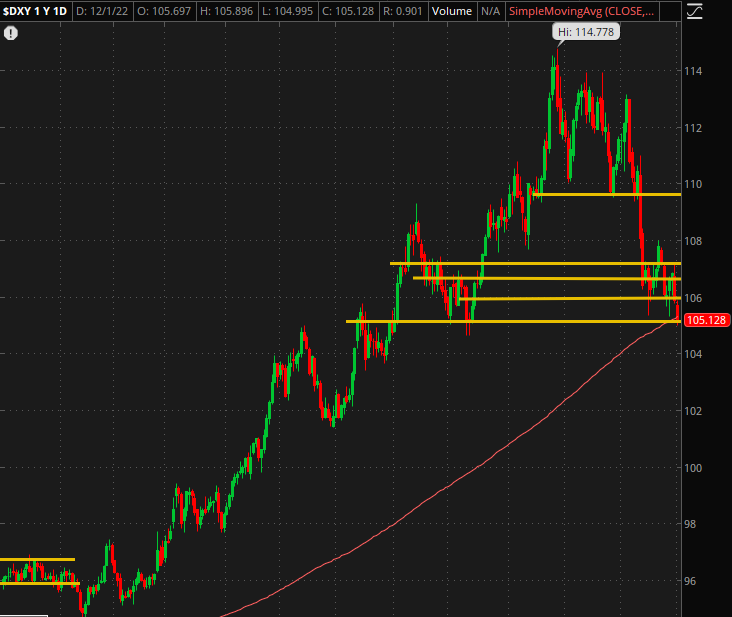
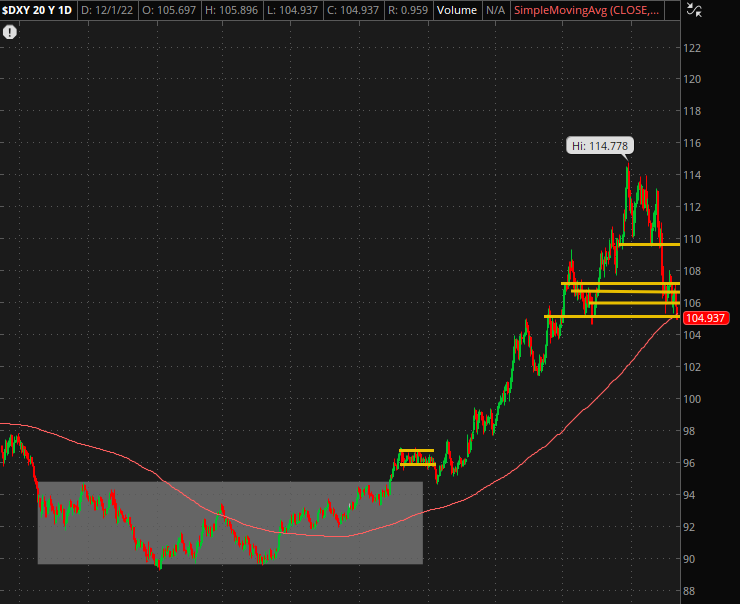
DXY which is the US Dollar Index has blasted from $95 to over $114 before coming down sharply and violently of what appears to be a BOOM+BUST chart.
Is this the BUST PHASE?
Or will it bounce off of this important level?
The important level…
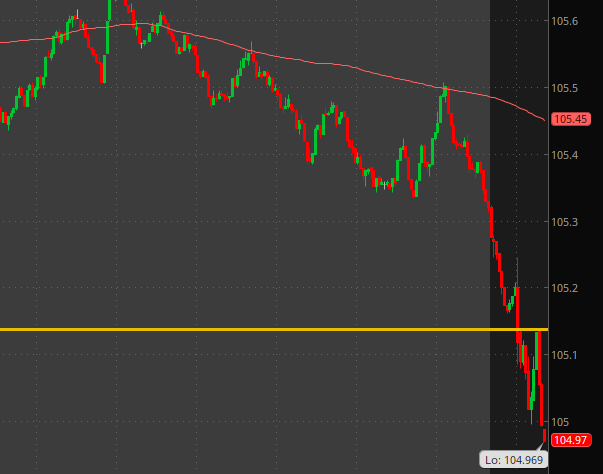
The important technical level here is going to be the $105 mark and the 200-day simple moving average which is illustrated above using the red line.
The US Dollar did bounce off the $105 mark before coming back down as Bulls and Bears battle for this territory.
This is the first time the US Dollar has traded under the 200 day simple moving average since this rally began back in June of 2020.
The Bottom Line
The bottom line is that the US Dollar is seeing MASSIVE SELLING PRESSURE!
A weaker dollar is GOOD FOR GROWTH STOCKS.
If the Dollar bounces, it could potentially cause pressure on stocks though, so this is of interest to equity traders!
DISCLAIMER: Lusso’s News LLC offers no guarantees and provides forward looking statements with intentions and sole purpose to satisfy the reader/viewer by offering only personal enjoyment and personal entertainment. If at any time a Security is purchased that is discussed at Lusso’s News, LLC on a written article, post, newsletter or comment, you agree to hold Lussosnews.Com liability free and harmless. There are no guarantees in participating in Financial Markets and full investment can be fully lossed at any time. Lusso’s News, LLC never guarantees and never offers recommendations. The company will not be responsible for any loss or damage that occurs. Anyone at Lusso’s News, LLC may be buying or selling any stock mentioned at any given time. FOR EDUCATIONAL AND INFORMATION PURPOSES ONLY; NOT INVESTMENT ADVICE. Any Lusso’s News, LLC Service and product offered is for educational and informational purposes only and should NOT be construed as a securities-related offer or solicitation, or be relied upon as personalized investment advice. Lusso’s News, LLC recommends you consult a licensed or registered professional before making any investment decision as you could lose your full investment at any given time as this is not a “risk-free” industry. If you do agree to this, then please exit our website now. LUSSO’S NEWS, LLC IS NOT AN INVESTMENT ADVISOR OR REGISTERED BROKER. Both, Lusso’s News, LLC nor any of its owners or employees are registered as a securities broker-dealer, broker, investment advisor (IA), or IA representative with the U.S. Securities and Exchange Commission, any state securities regulatory authority, or any self-regulatory organization. We do NOT give out advice, this is intended to be ONLY a publication for information and education. THE ABOVE POWERHOUSE REPORT INFORMATION IS SUBJECT TO OUR TERMS AND CONDITIONS AND DISCLAIMER. OUR REPORT IS FOR INFORMATION PURPOSES ONLY AND IS NOT BUY OR SELL INVESTMENT OR TRADE ADVICE. NO SPECIFIC OUTCOME OR PROFIT IS GUARANTEED AND FULL RISK APPLIES OF LOSING MONEY ON A TRADE. OUR WRITERS AND TRADERS ARE NOT LICENSED OR FINANCIAL ADVISORS.


